Medspa E
The most engaging creative in the account produced nothing
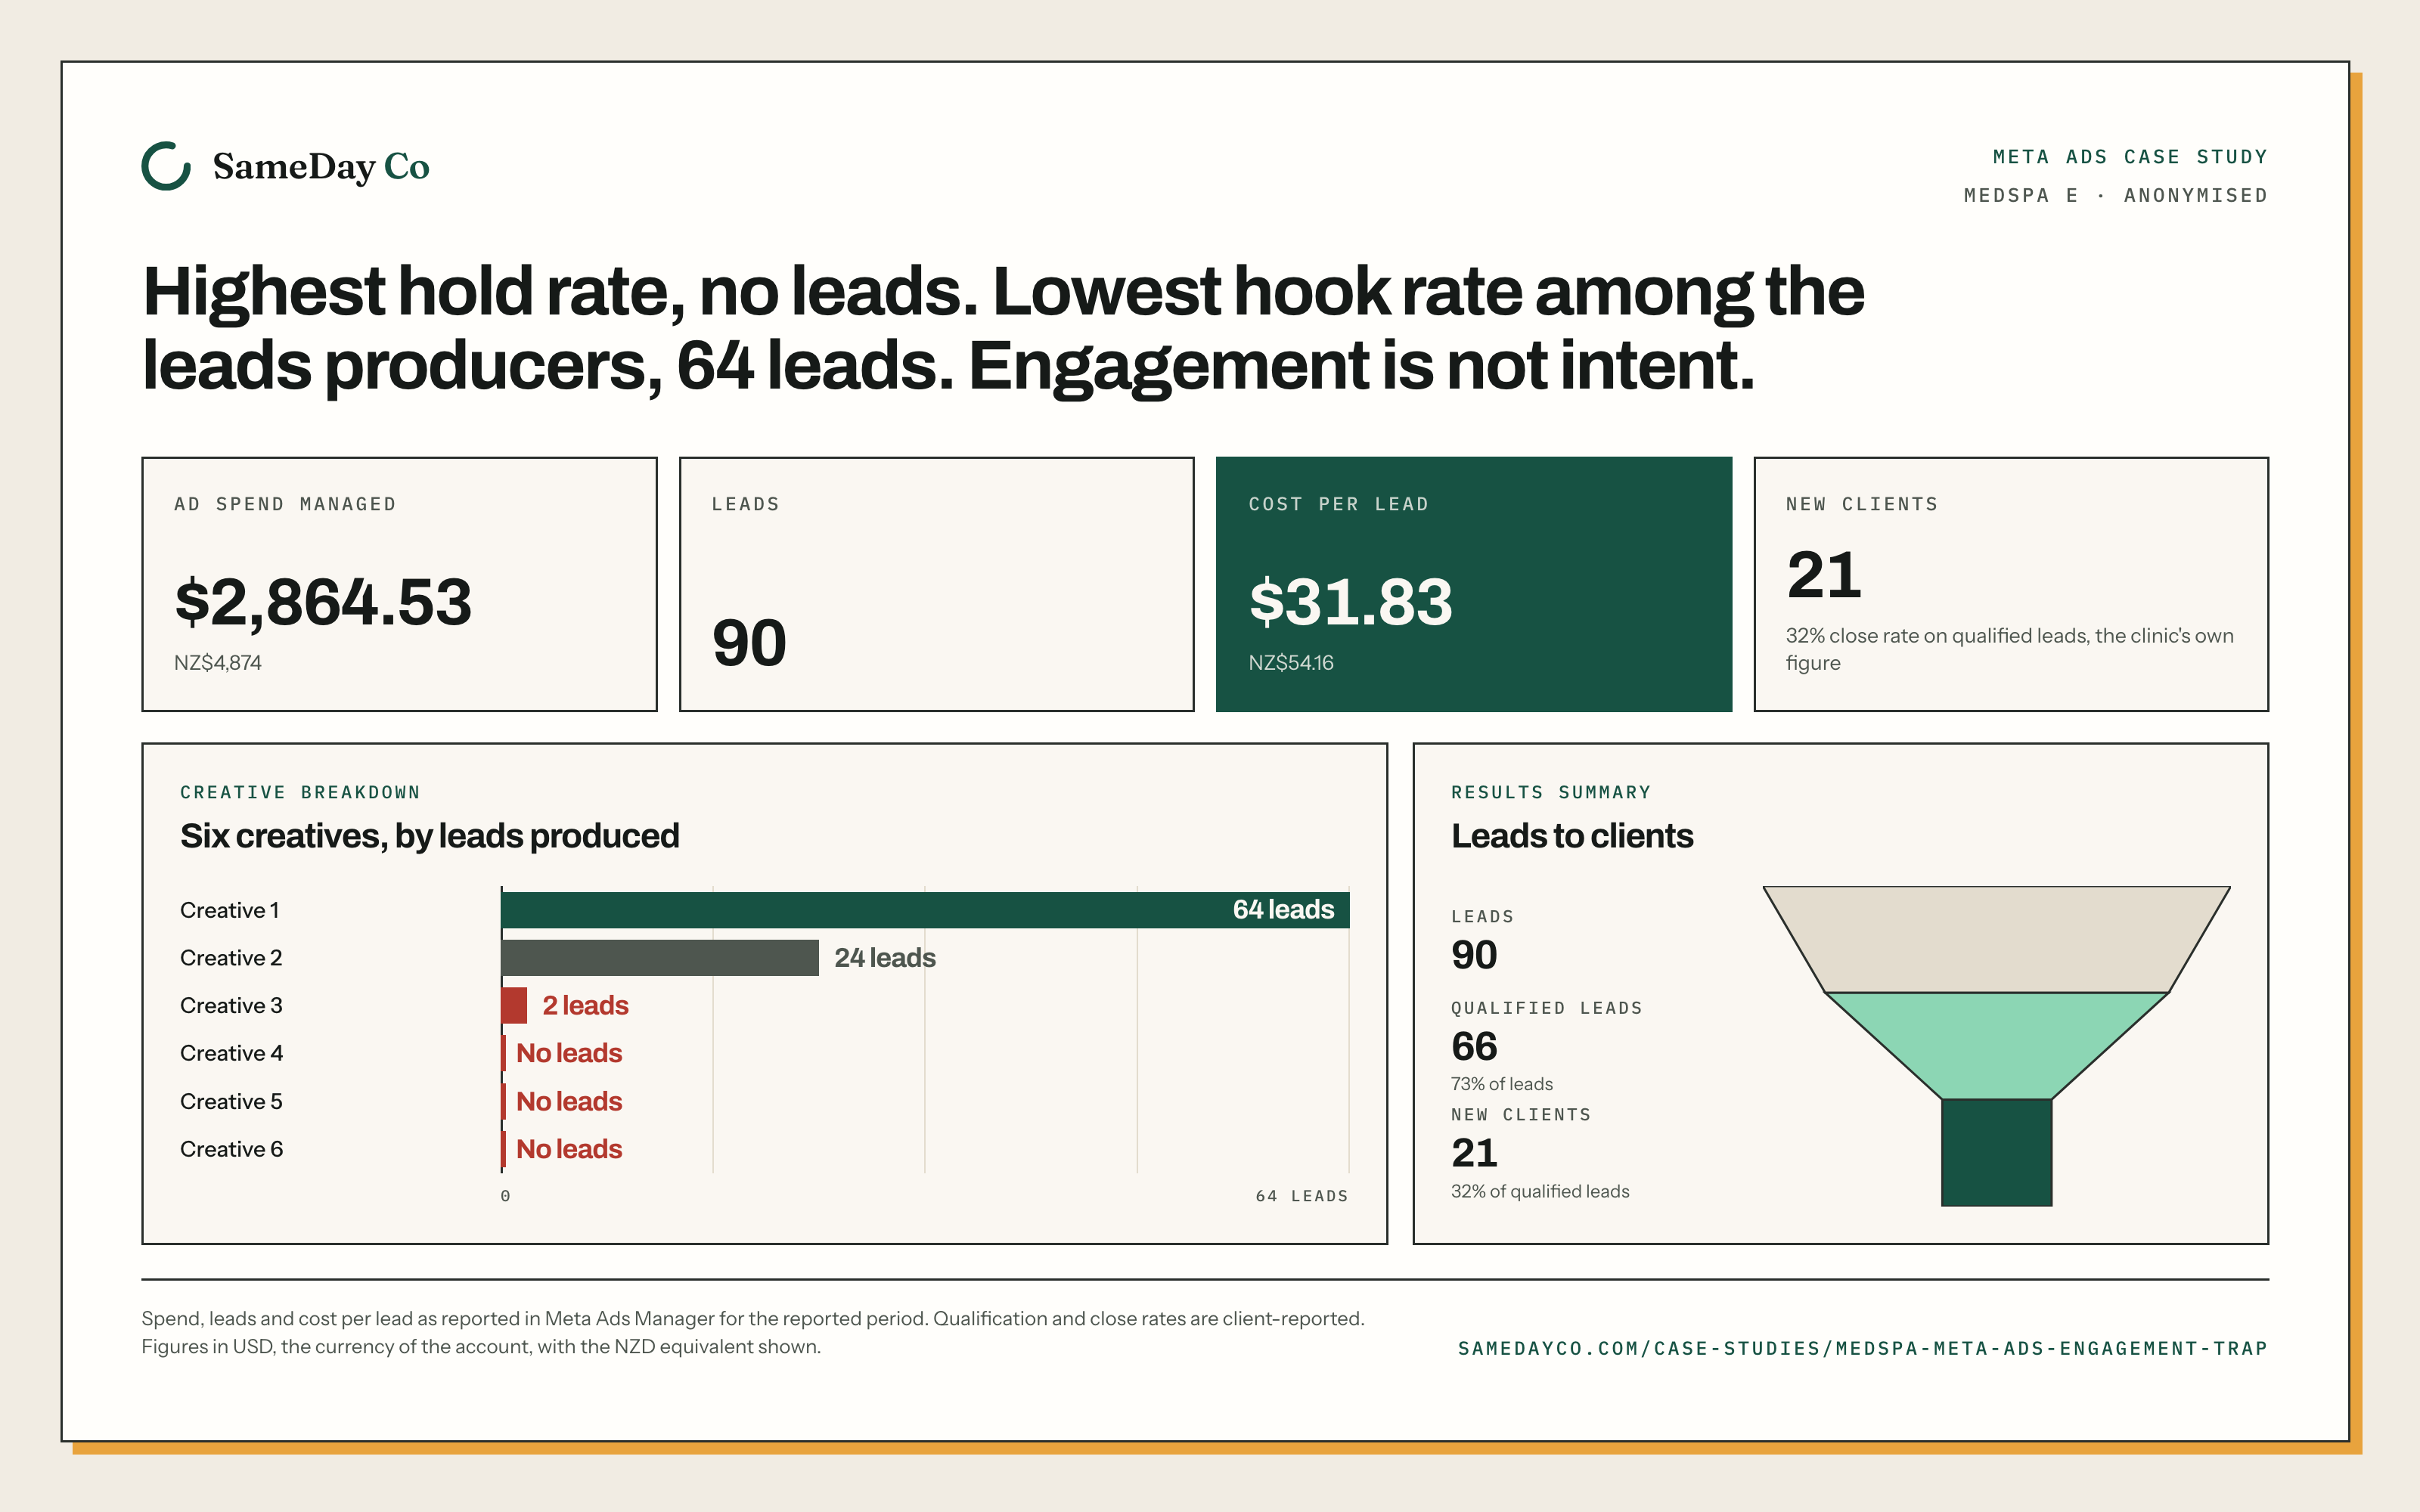
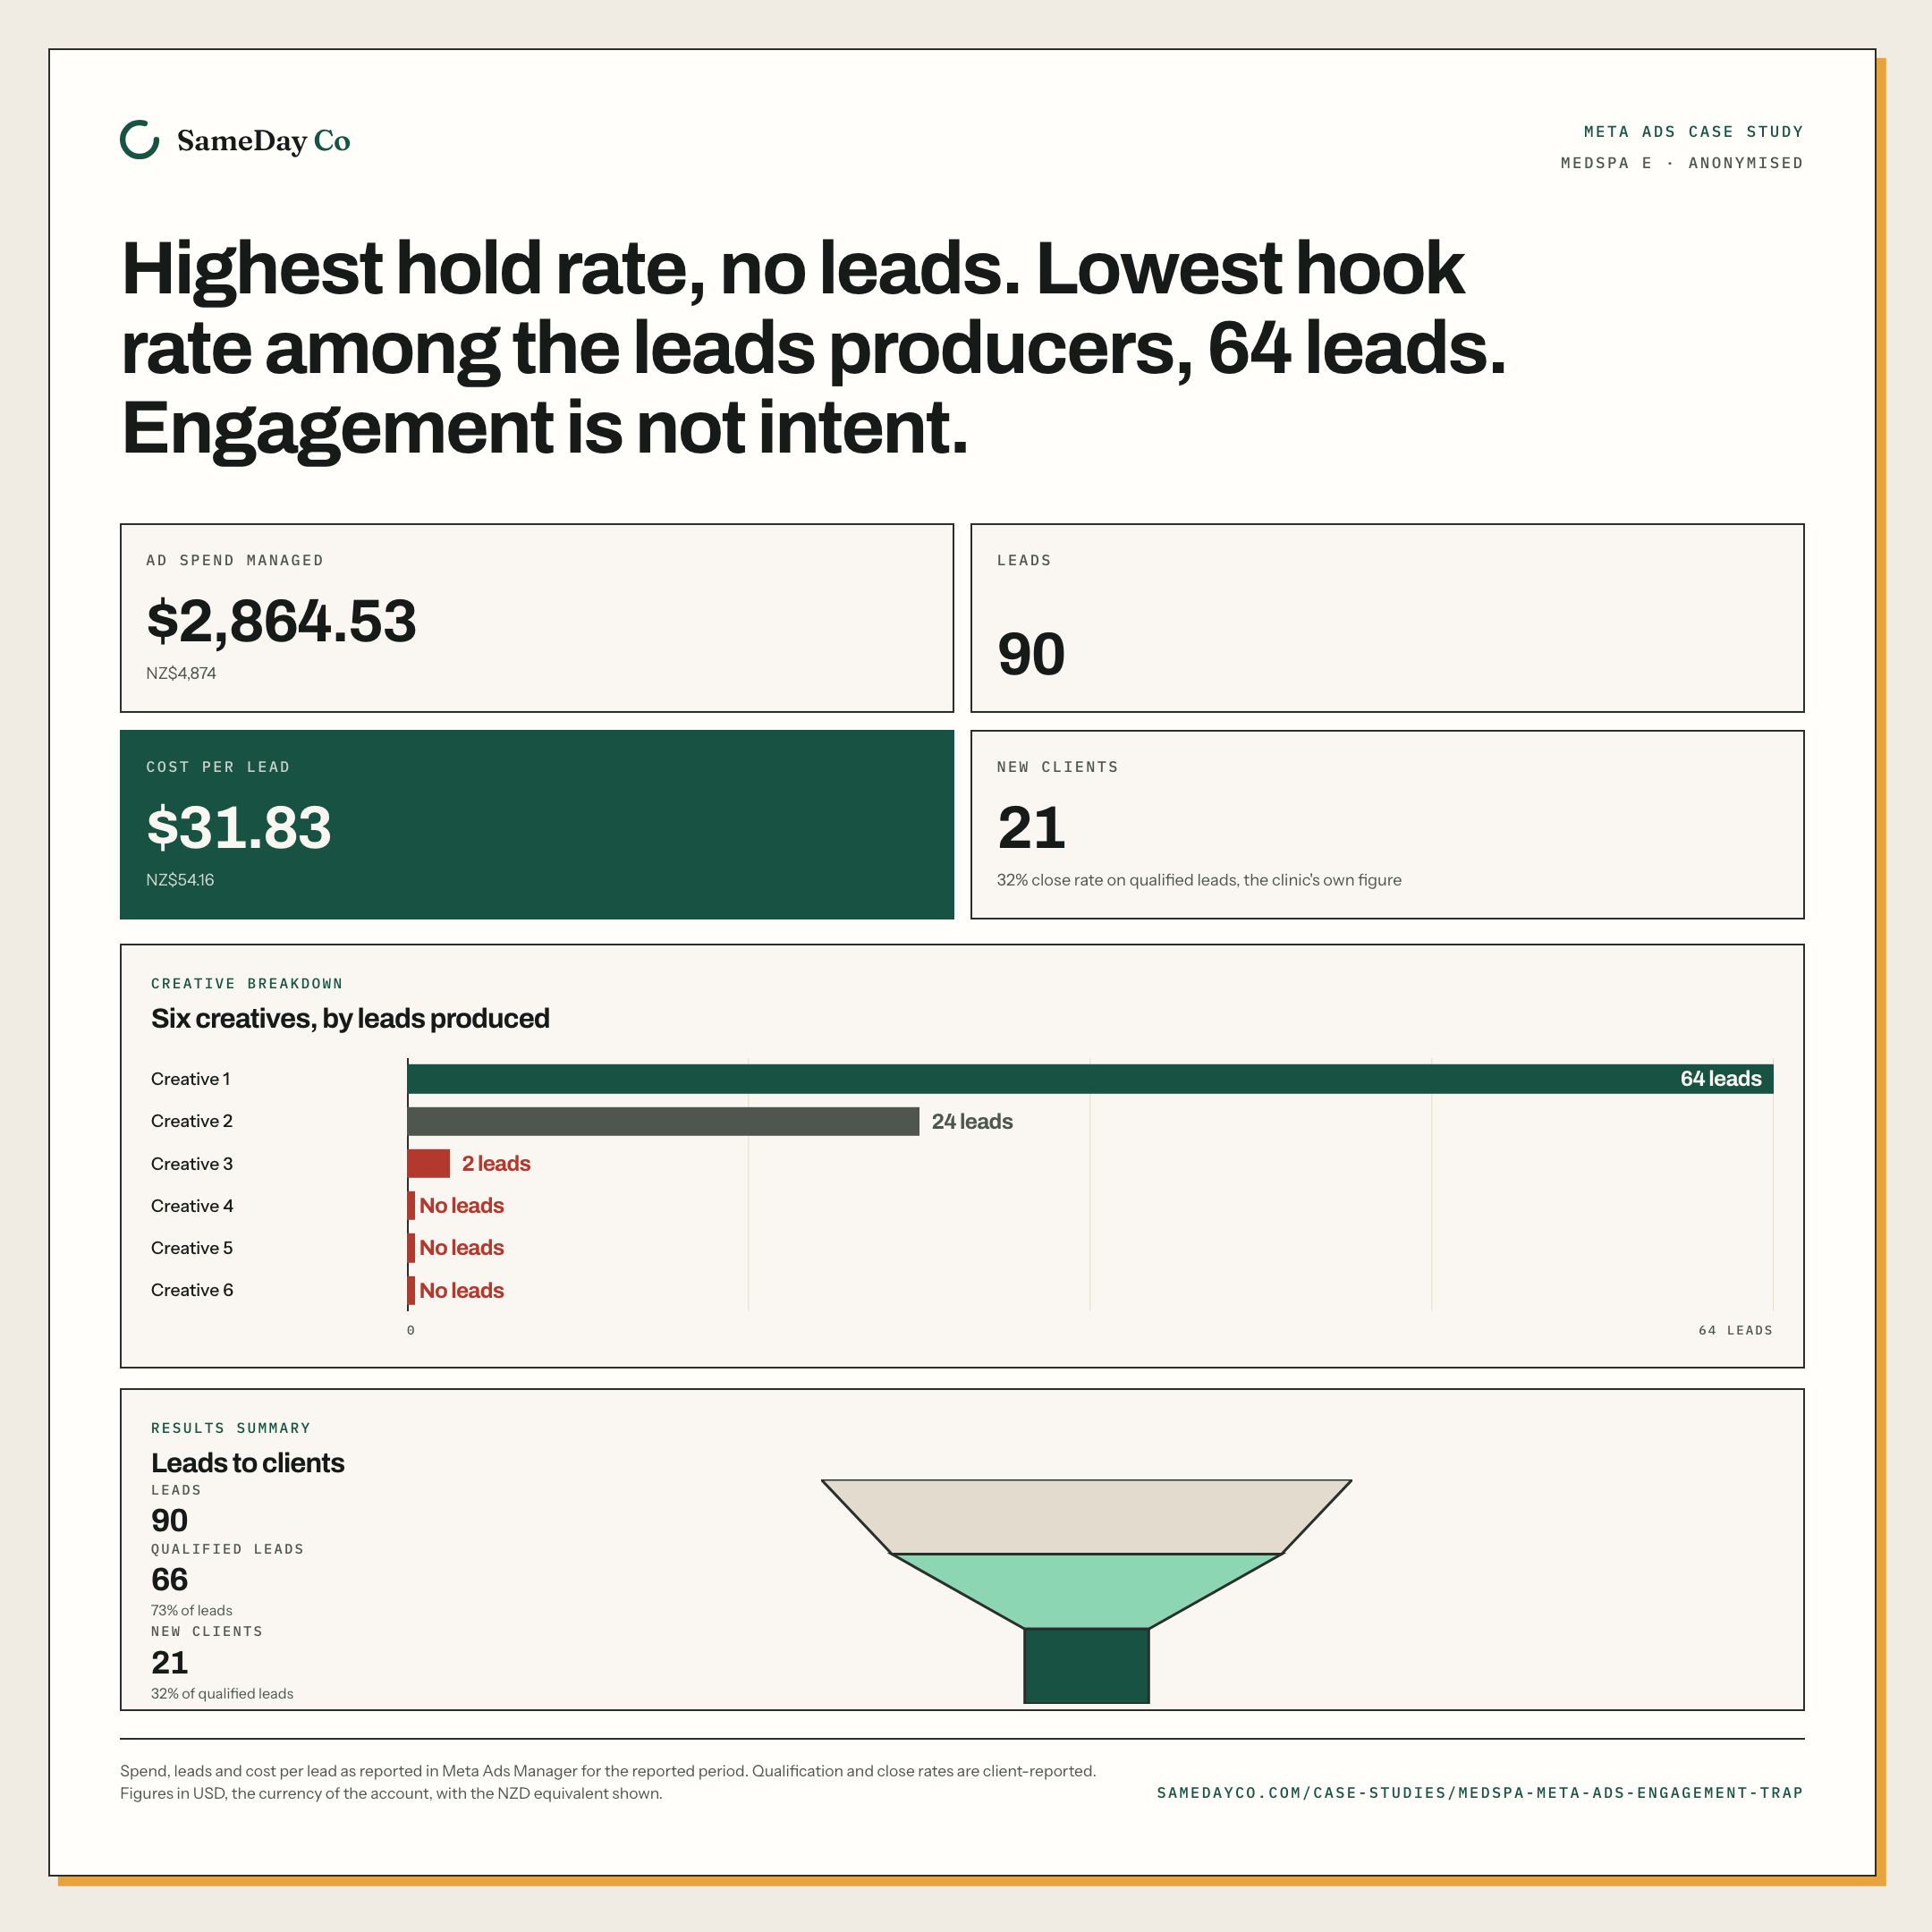
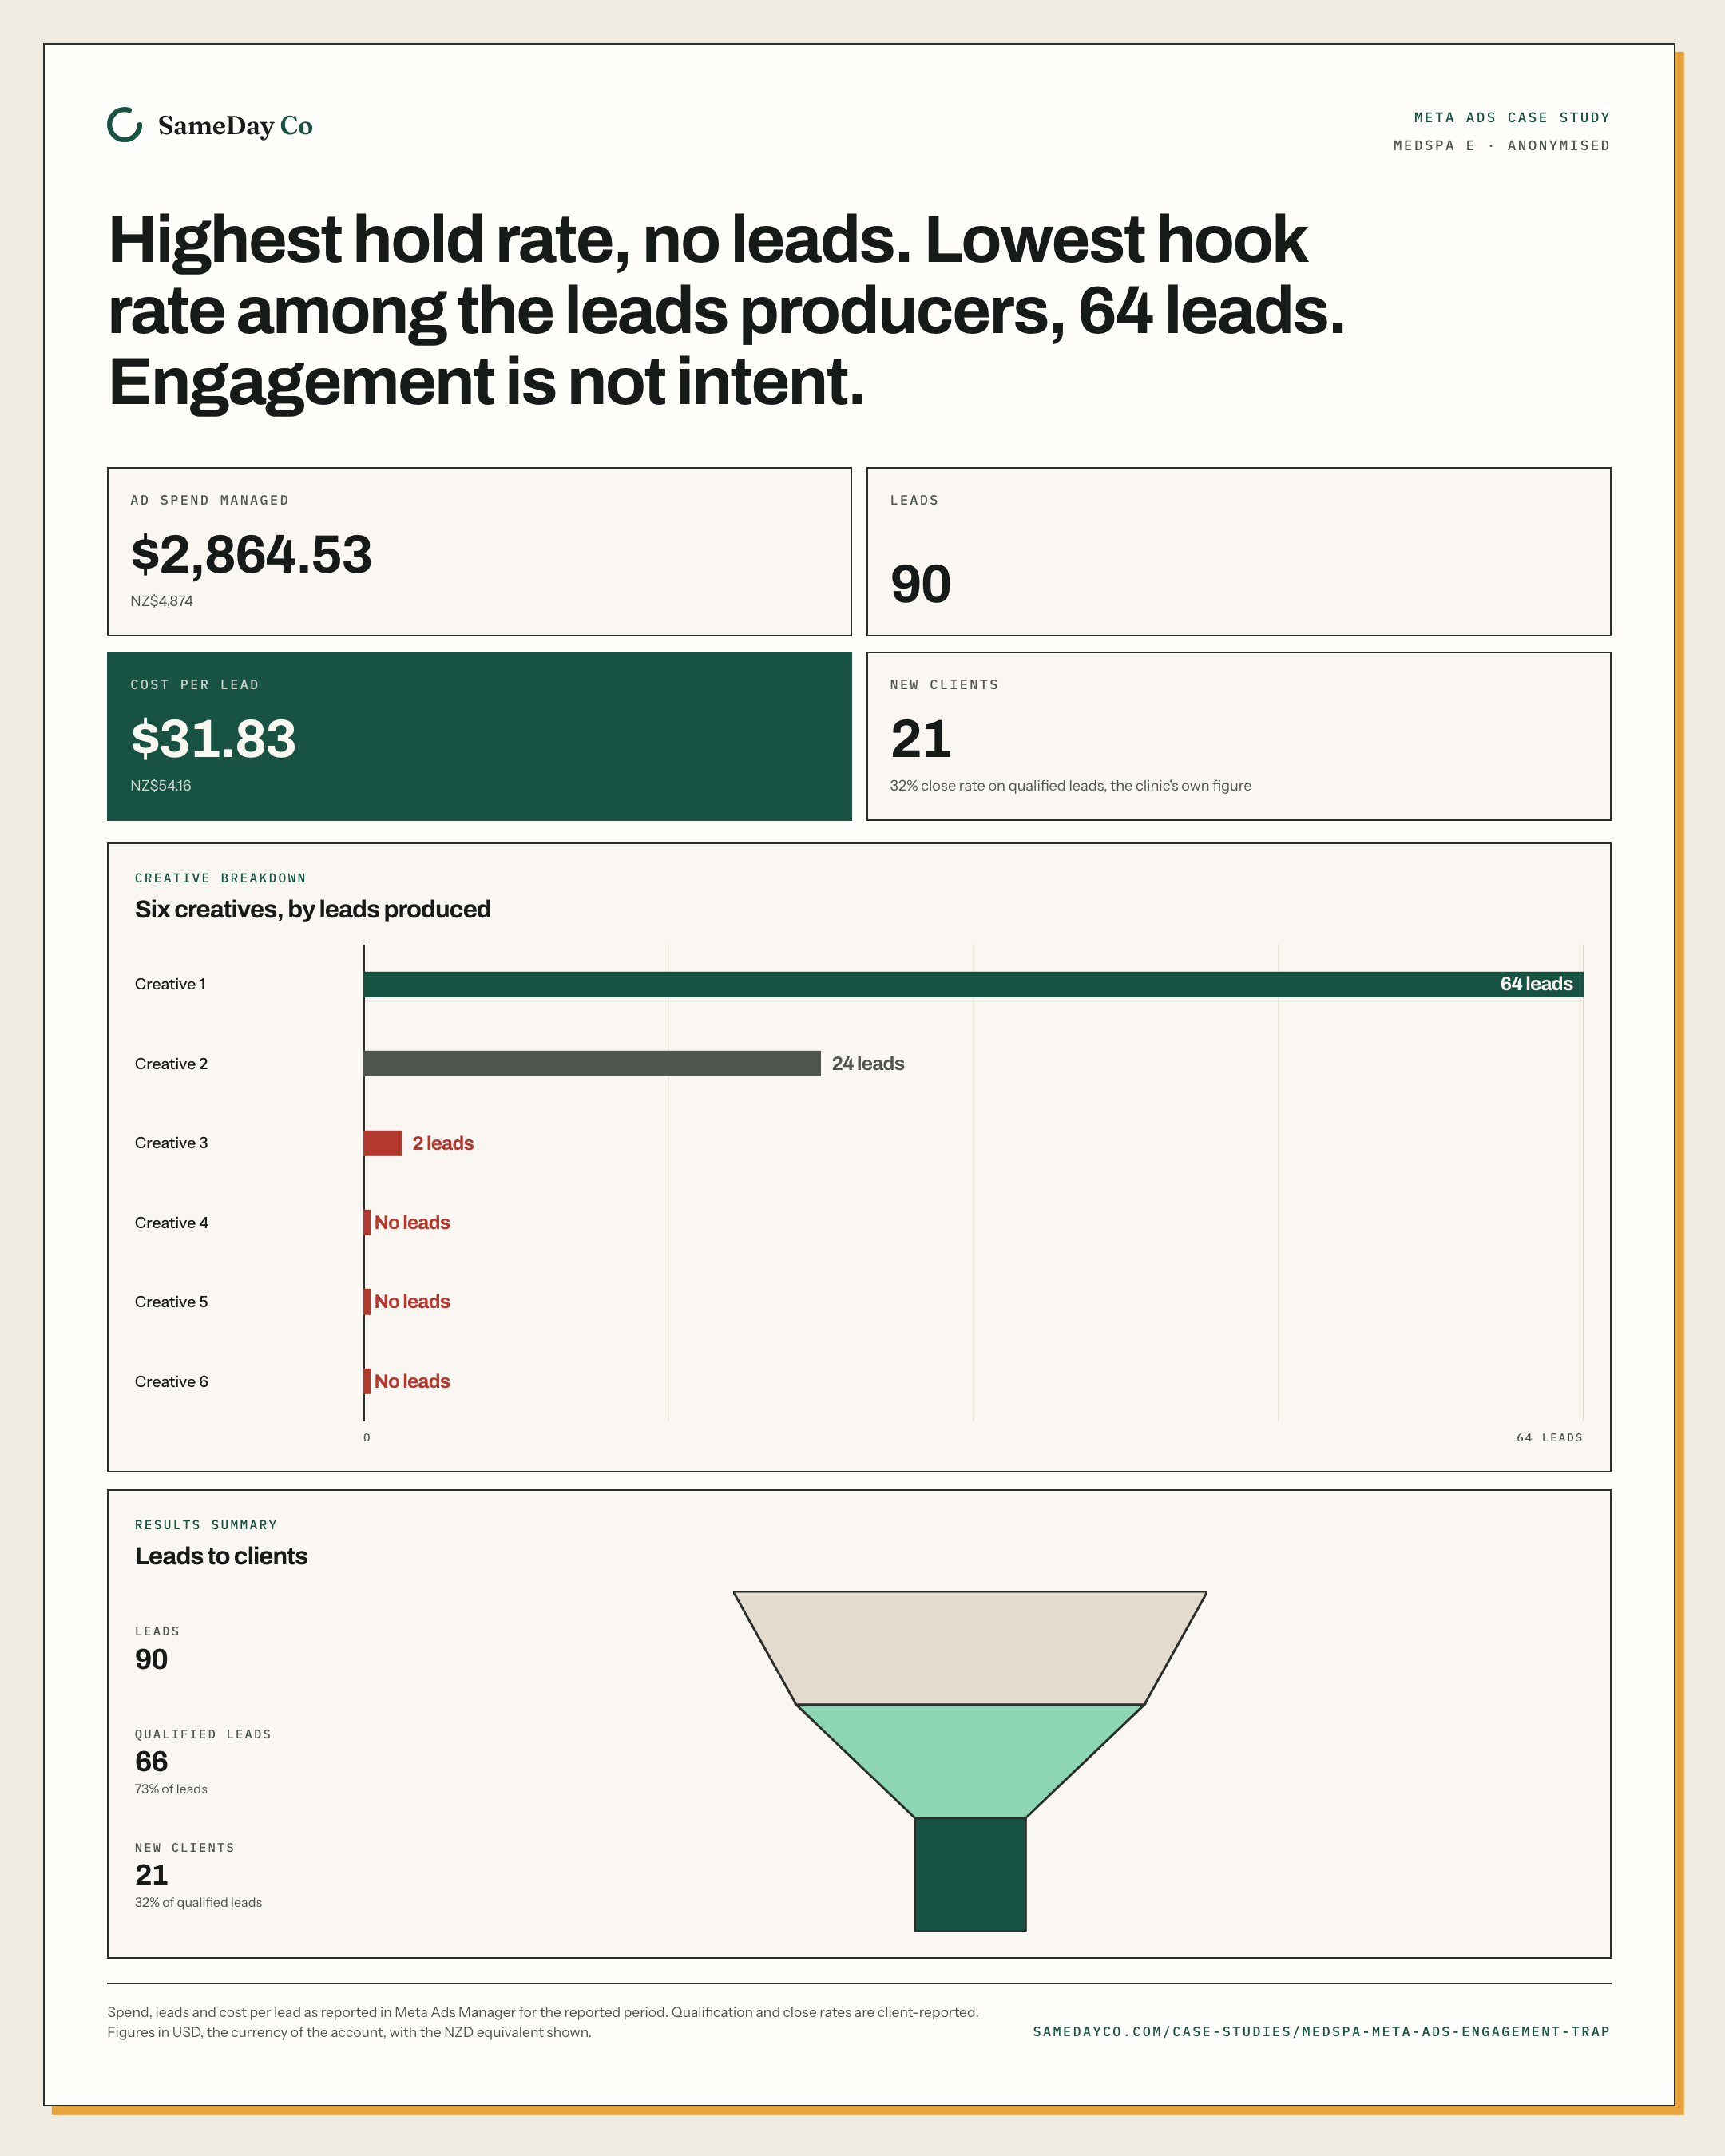
The creative with the best hold rate in this account, 50.26%, produced no leads at all. The creative with the lowest hook rate of any creative that produced a lead, 5.50%, produced 64 of its 90 leads. Engagement and intent are different things, and this account paid $2,864.53 to demonstrate the difference.
Medspa · US$2,864.53 · Published 2026-08-05
The numbers
What the account actually did.
Figures are as recorded in the platform export for this account. United States dollars as spent, New Zealand dollars underneath at the rate on the methodology page.
- Ad spend managed
- $2,864.53NZ$4,874
- Leads
- 90
- Cost per lead
- $31.83NZ$54.16
- Qualified leads
- 6673% of leads, the clinic's own figure
- New clients
- 2132% close rate on qualified leads, the clinic's own figure
- Cost per new client
- $136.25NZ$231.83
Hold rate falls as video length rises: a short clip reports a far higher hold rate than a long one with no difference in quality. The runtimes behind these six creatives have not been pulled or normalised, so every hold rate below should be read with that in mind. This caveat is scoped to hold rate. It does not extend to hook rate or to the lead counts elsewhere on this page.
Download this account as an image
The contradiction
Creative 4 held 50.26% of its viewers, the best in the account, and produced no leads. Creative 1 hooked 5.50%, the lowest of any creative that produced a lead, and produced 64.
01
What the account was
Medspa E ran $2,864.53 of Meta Ads spend across 90 leads over the reported period, at a blended $31.83 cost per lead. The channel was Meta, Facebook and Instagram, video was the creative format across all six creatives, and the offer ran to a lead-generation form. The exact campaign window is still being confirmed against the platform export.
The clinic is anonymised throughout, and the market it operated in is not stated. Six creatives ran in this account, and what follows is what their engagement numbers said against what they actually produced.
02
The $556.06 that produced nothing
Six creatives ran in this account. Creative 1 produced 64 leads on $1,238.01 at $19.34 each, the lowest hook rate of any creative that produced a lead at 5.50%, and a 25.88% hold rate. Creative 2 produced 24 leads on $742.50 at $30.94 each. Creative 3 produced 2 leads on $327.96 at $163.98 each, and had the highest hook rate in the account at 24.72%.
Creatives 4, 5 and 6 produced no leads at all, and between them they spent $556.06: $322.58 on Creative 4, $20.16 on Creative 5 and $213.32 on Creative 6. Creative 4 held the highest hold rate in the entire account, 50.26%, and still produced nothing. That $556.06 should have gone to the two creatives already shown to be working, Creative 1 and Creative 2, days into the flight rather than after it ended.
Medspa E, creative breakdown
Six creatives, by leads produced
Six creatives, by leads produced. Bars are counts. Creative 1, 64 leads. Creative 2, 24 leads. Creative 3, 2 leads. Creative 4, No leads. Creative 5, No leads. Creative 6, No leads.
- Creative 164 leads
$1,238.01 spent, $19.34 per lead, 25.88% hold, 5.50% hook
- Creative 224 leads
$742.50 spent, $30.94 per lead, 23.59% hold, 10.01% hook
- Creative 32 leads
$327.96 spent, $163.98 per lead, 40.94% hold, 24.72% hook
- Creative 4No leads
$322.58 spent, 50.26% hold, the best in the account, 19.24% hook
- Creative 5No leads
$20.16 spent, 15.38% hold, 1.70% hook
- Creative 6No leads
$213.32 spent, 24.14% hold, 0.38% hook
This chart counts leads rather than cost per lead on purpose: three of these creatives produced no leads, and there is no such thing as a cost per lead when the count is zero. Together those three spent $556.06.
03
Hold rate and hook rate ranked these creatives backwards
Grouped by what they produced rather than by any engagement number, two creatives brought in 88 of the account's 90 leads on $1,980.51, at $22.51 per lead. The other four brought in 2 leads on $884.02, at $442.01 per lead. Hold rate and hook rate ran the other way entirely: the group that produced almost nothing held 32.68% of its viewers and hooked 11.51% of them, both higher than the group that did almost all the work, at 24.73% and 7.75%.
Ranked by hold rate or hook rate, the wrong group wins. Ranked by leads, the right one does. The hold rate gap between the two groups is not adjusted for video length, and it does not need to be to make the point: the group that held and hooked better is the group that produced almost nothing, and in this account the only ranking worth trusting is the one that counts what a creative actually produced.
Medspa E, creative breakdown
The two creatives that worked against the four that did not
The two creatives that worked against the four that did not. Comparing The top two creatives against The other four. Spend: $1,980.51 against $884.02. Leads: 88 against 2. Cost per lead: $22.51 against $442.01. Hold rate: 24.73% against 32.68%. Hook rate: 7.75% against 11.51%.
| Measure | The top two creatives | The other four |
|---|---|---|
| Spend | $1,980.51 | $884.02 |
| Leads | 88 | 2 |
| Cost per lead | $22.51 | $442.01 |
| Hold rate | 24.73% | 32.68% |
| Hook rate | 7.75% | 11.51% |
The two groups are named by what they produced, not by a label the platform applied. The group with the better hold rate and the better hook rate is the group that produced almost nothing. Hold rate here has not been adjusted for video length; see the note above.
04
Ninety leads to twenty-one new clients
90 leads became 66 qualified leads, a 73% qualification rate the clinic reported from its own records. Those 66 qualified leads became 21 new clients, a 32% close rate on qualified leads, also the clinic's own figure. New client count is derived as leads times qualification rate times close rate, then rounded, rather than a raw headcount from the CRM.
Cost per new client came out at $136.25. Two creatives out of six did essentially all of this funnel's work: the other four are what turned a $22.51 group cost per lead into a $31.83 account-wide average.
Medspa E, results summary
Leads to clients
Leads to clients. Leads: 90. Qualified leads: 66, 73% of leads. New clients: 21, 32% of qualified leads.
- 90Leads
- 66Qualified leads
73% of leads
- 21New clients
32% of qualified leads
Ninety leads across six creatives, two of which did the work. New client count is derived from leads, qualification rate and close rate, then rounded.
05
What transfers to a New Zealand clinic
Pair this account with chiropractic clinic D, elsewhere in this set. There, hold rate correlated with cost per lead at -0.665, a real and useful signal: the creative that held attention longer bought cheaper leads. Here, the creative that held attention longest, at 50.26%, bought no leads at all. Both findings come from unmodified platform data in the same portfolio.
The honest conclusion is not that hold rate is useless or that it is reliable. It is that engagement metrics predict conversion in some accounts and mislead in others, and an account has to establish which one it is before building any rule on top of them. That is exactly why hold rate and hook rate cannot be the thing a New Zealand clinic optimises towards without first checking what they actually correlate with in that clinic's own data.
Case studies reflect specific clinics and circumstances. Outcomes depend on market, budget, competition, clinic capacity, reception follow-up, timing and account history. Figures are historical examples, not typical-results claims, forecasts or guarantees.

The free Ad Check
Two written pages on your clinic's advertising. Free.
Your ads, site and Google profile wording, reviewed against your profession's advertising rules, the ASA Therapeutic and Health Advertising Code and the Fair Trading Act. In your inbox within two NZ business days. No call, no follow-up sequence, no obligation.
Free · Async · Two NZ business days