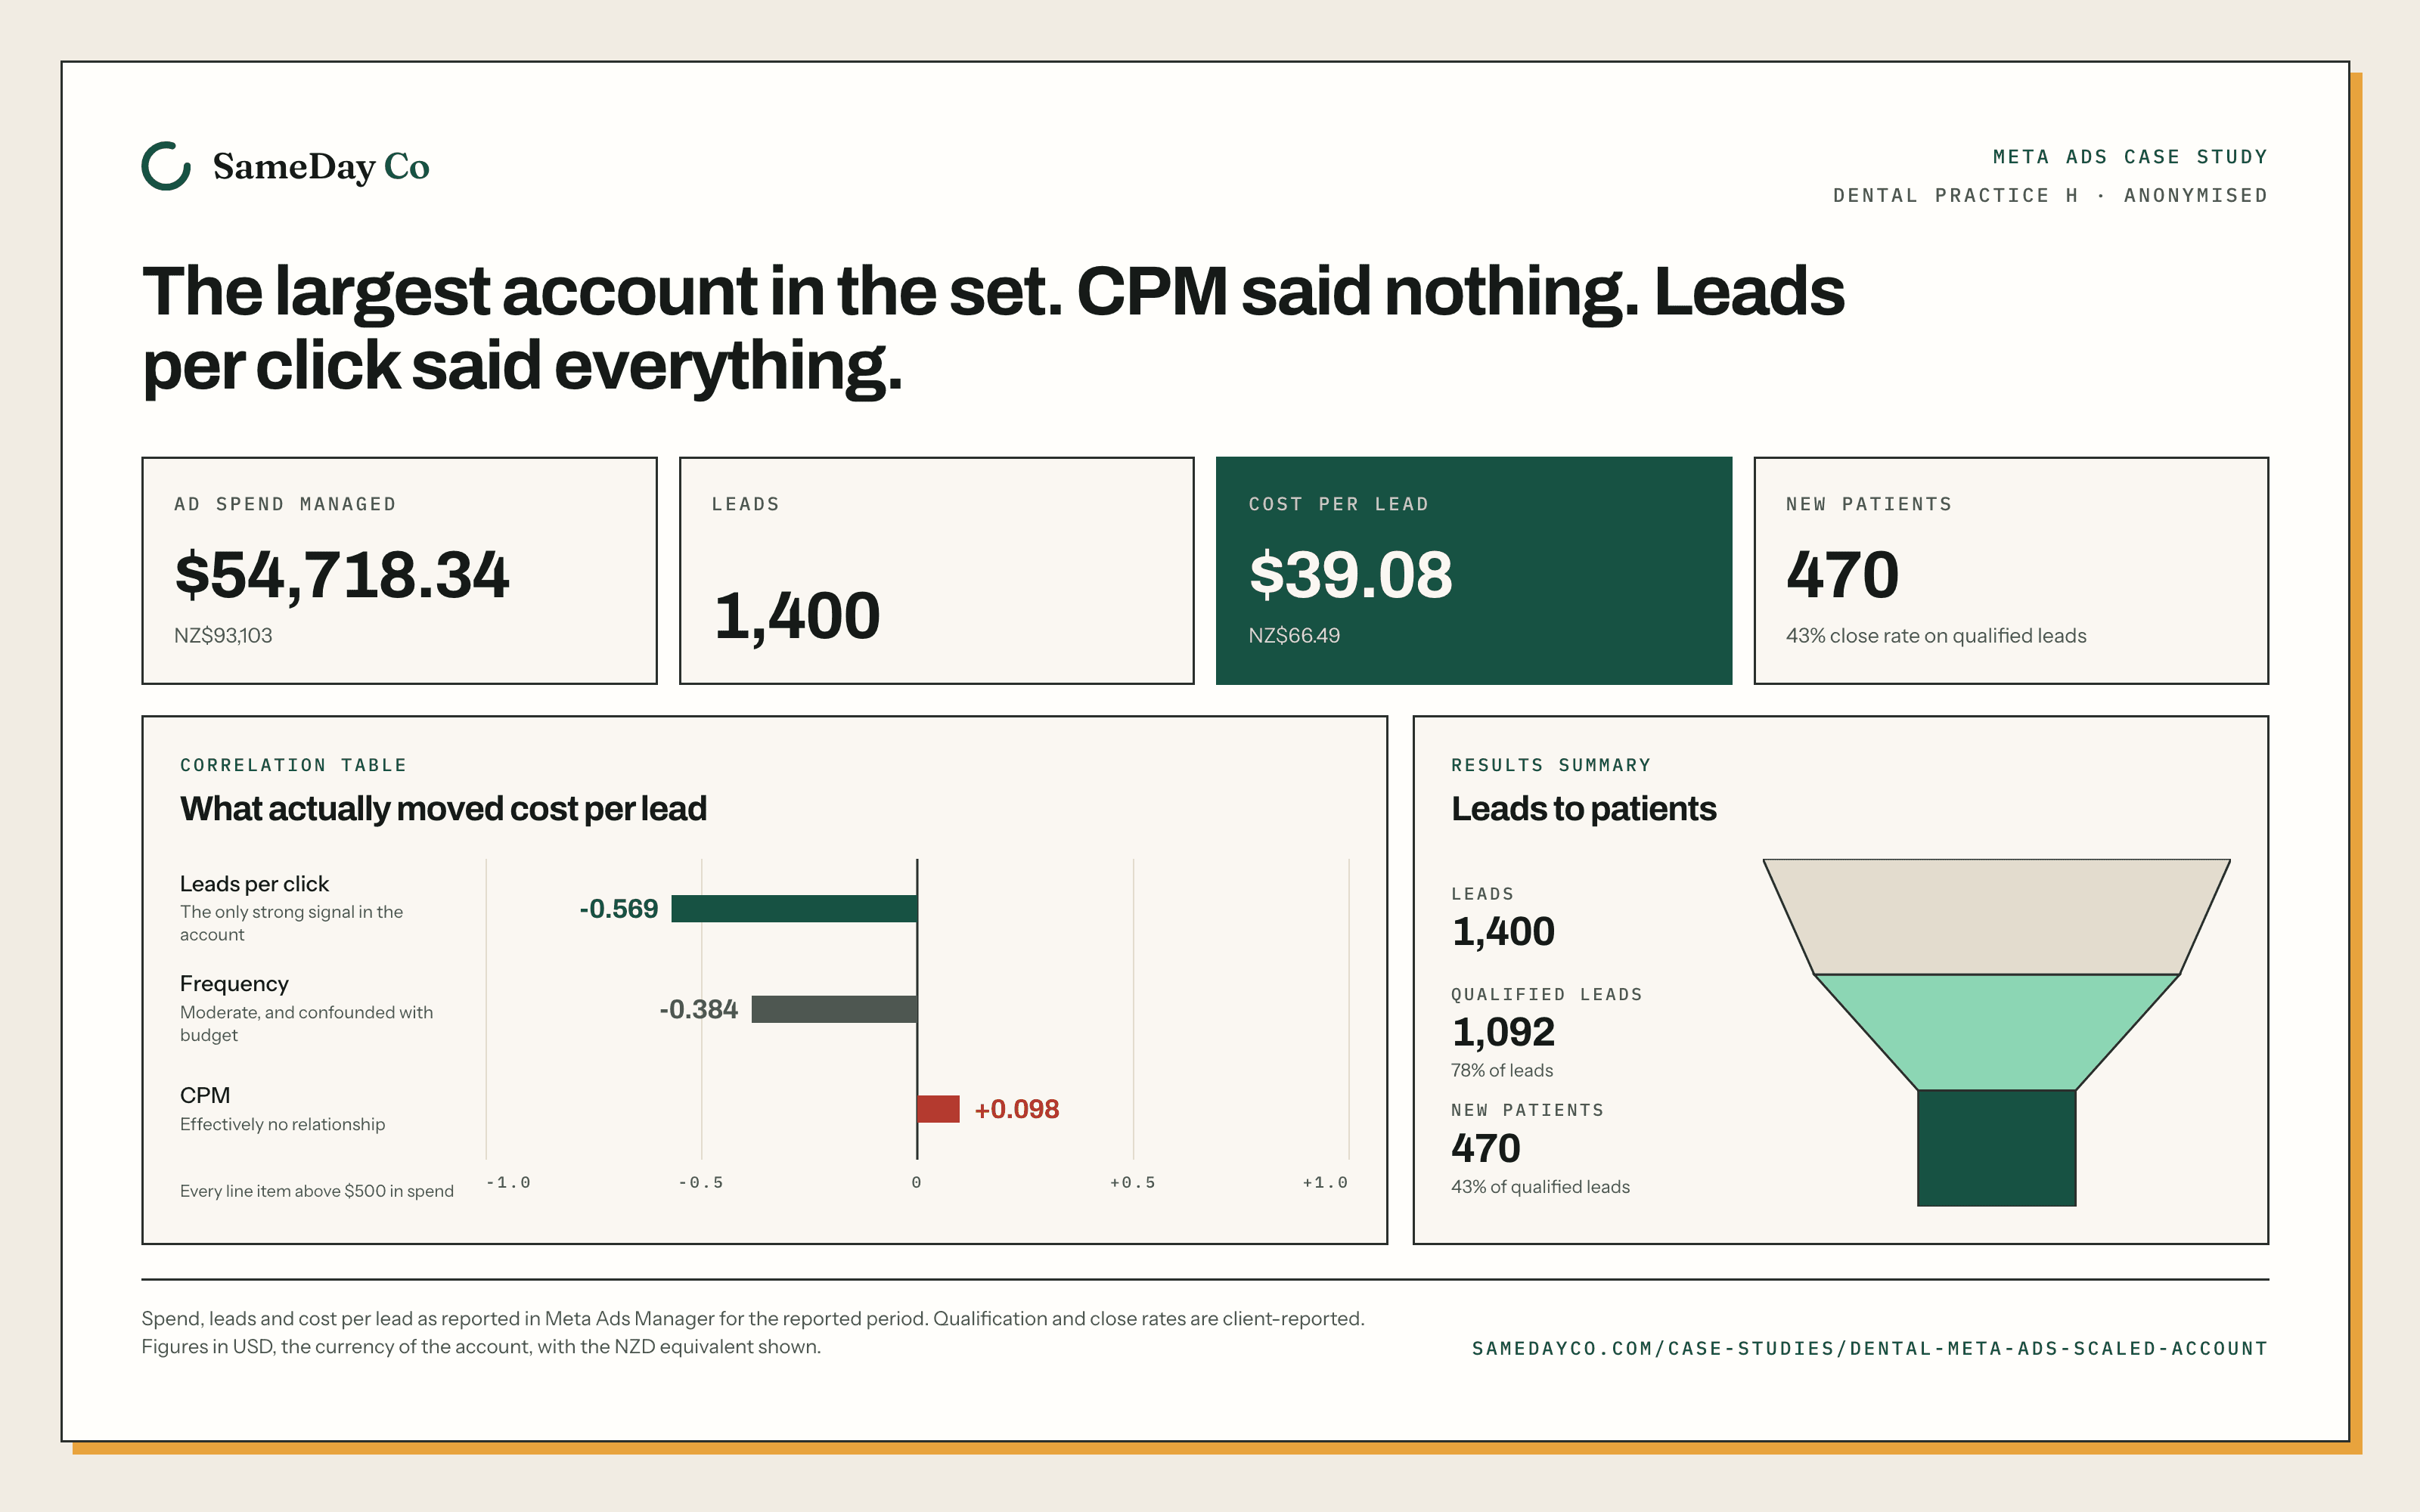
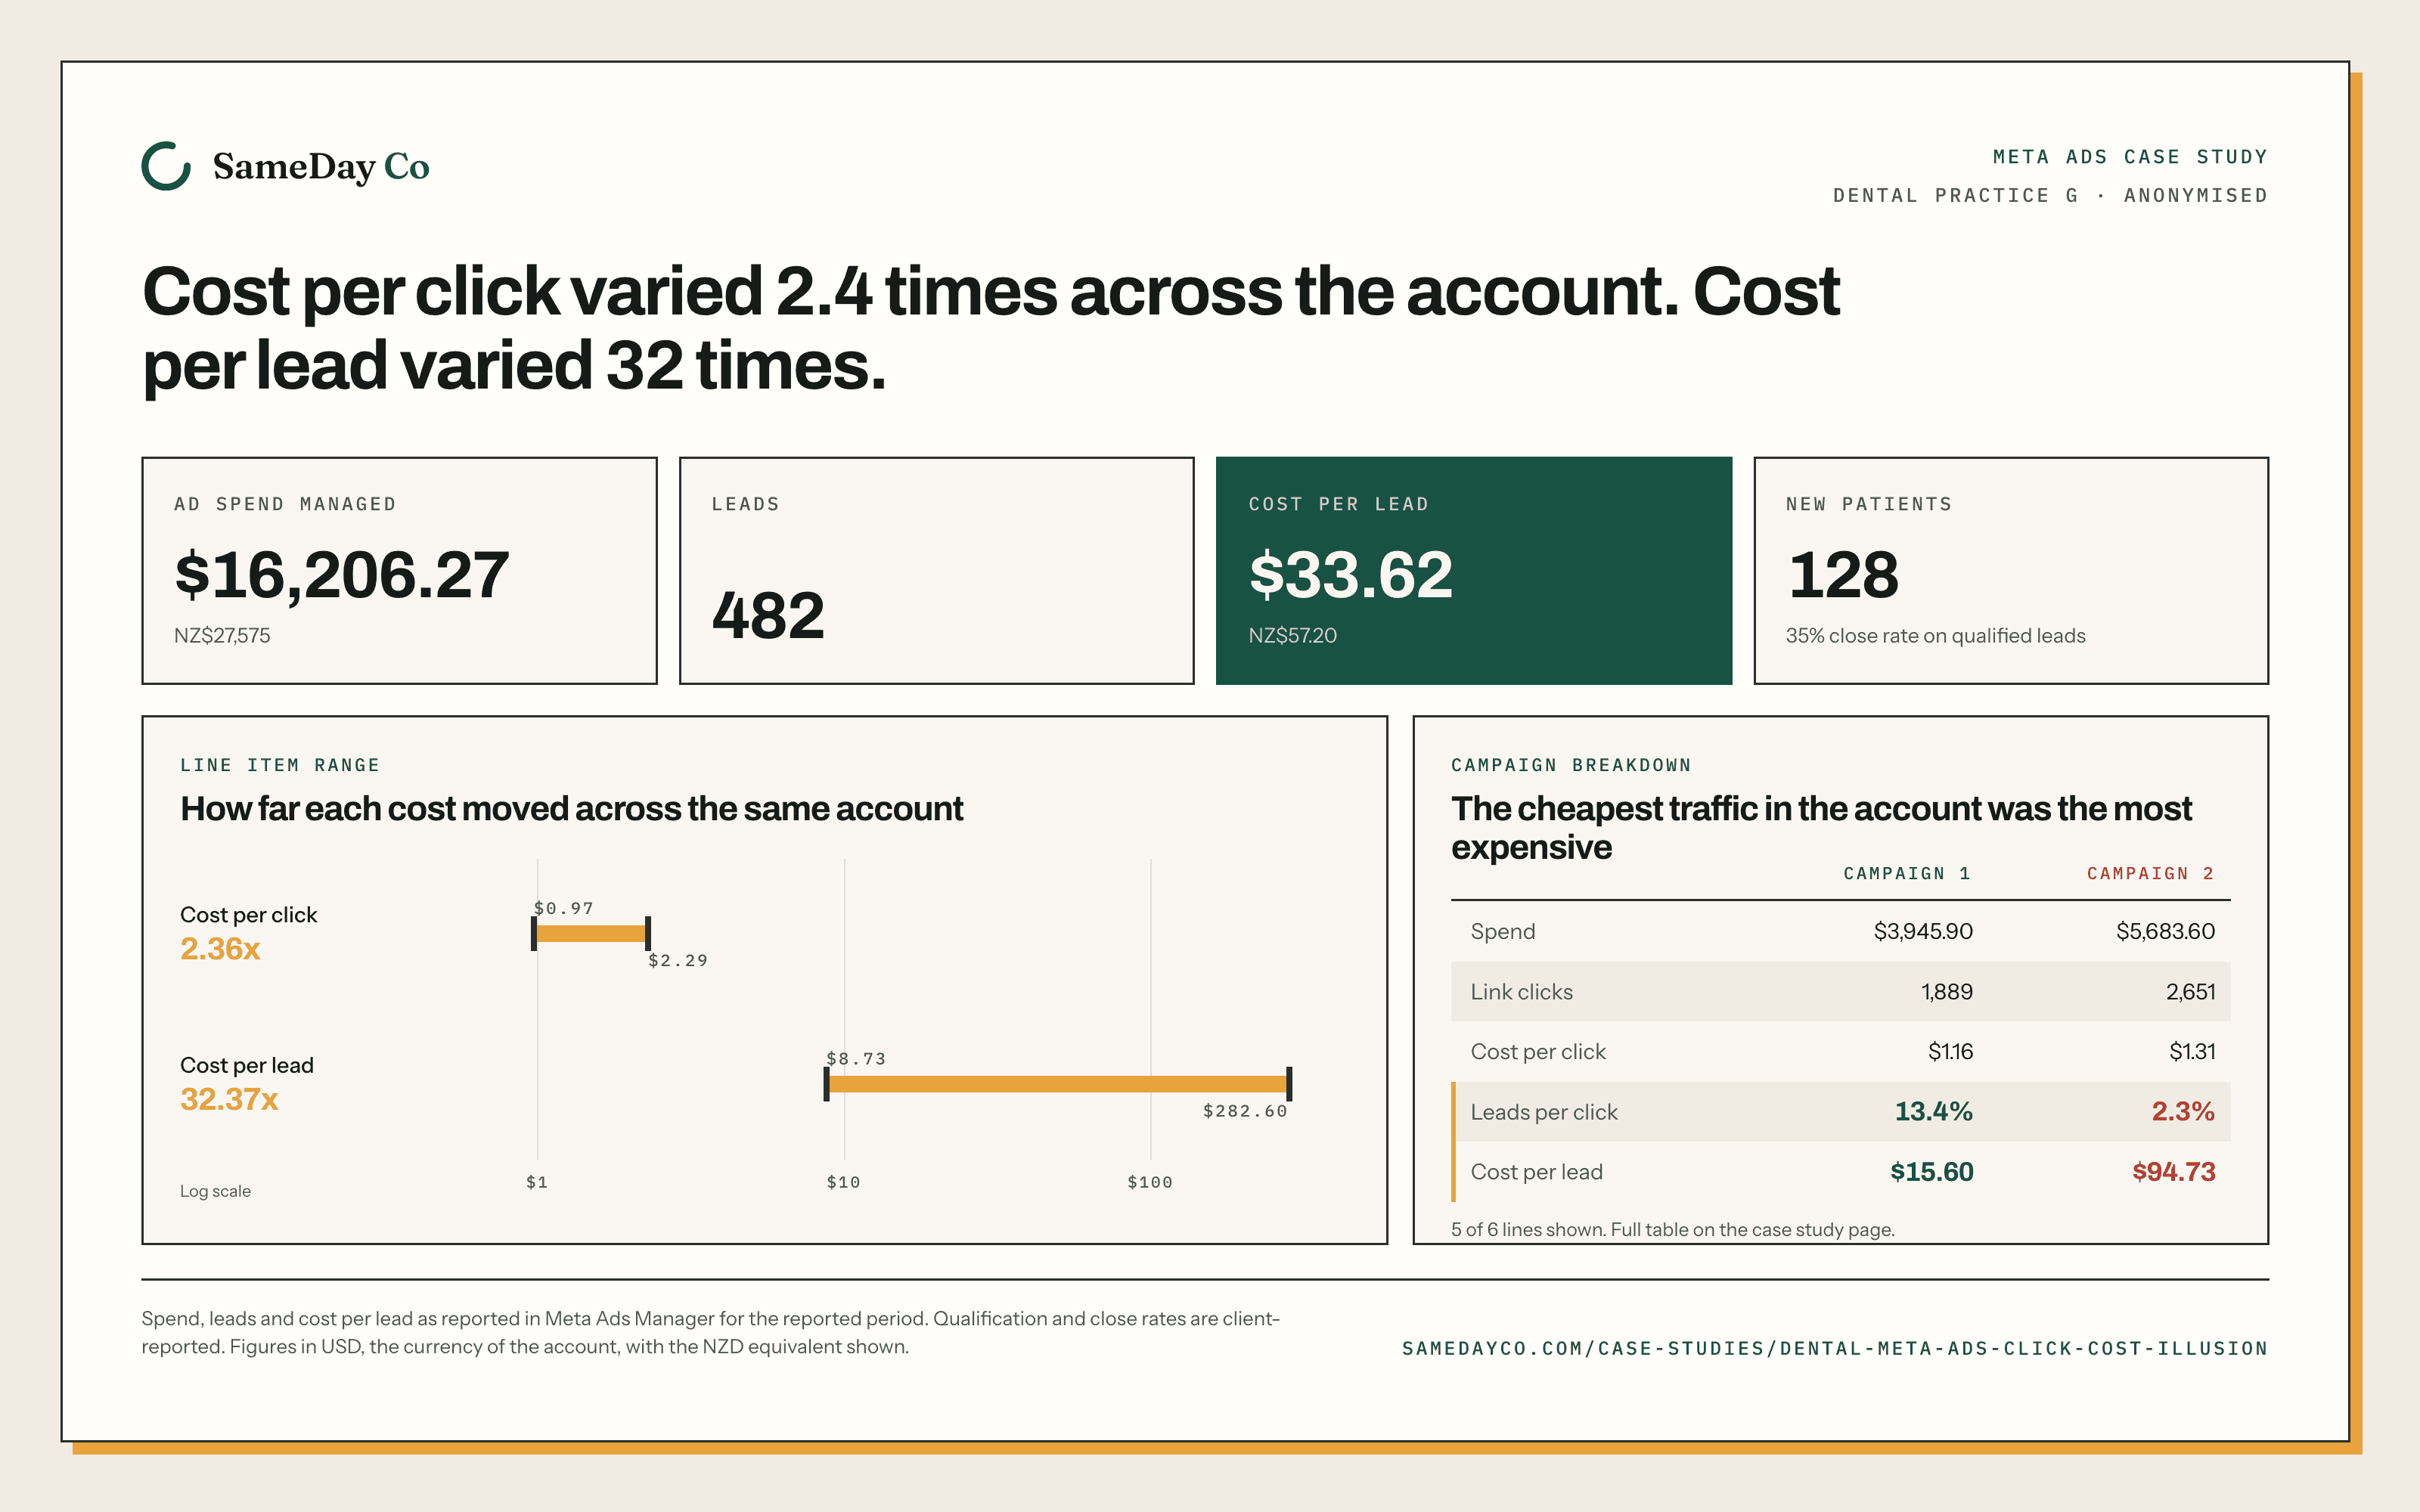
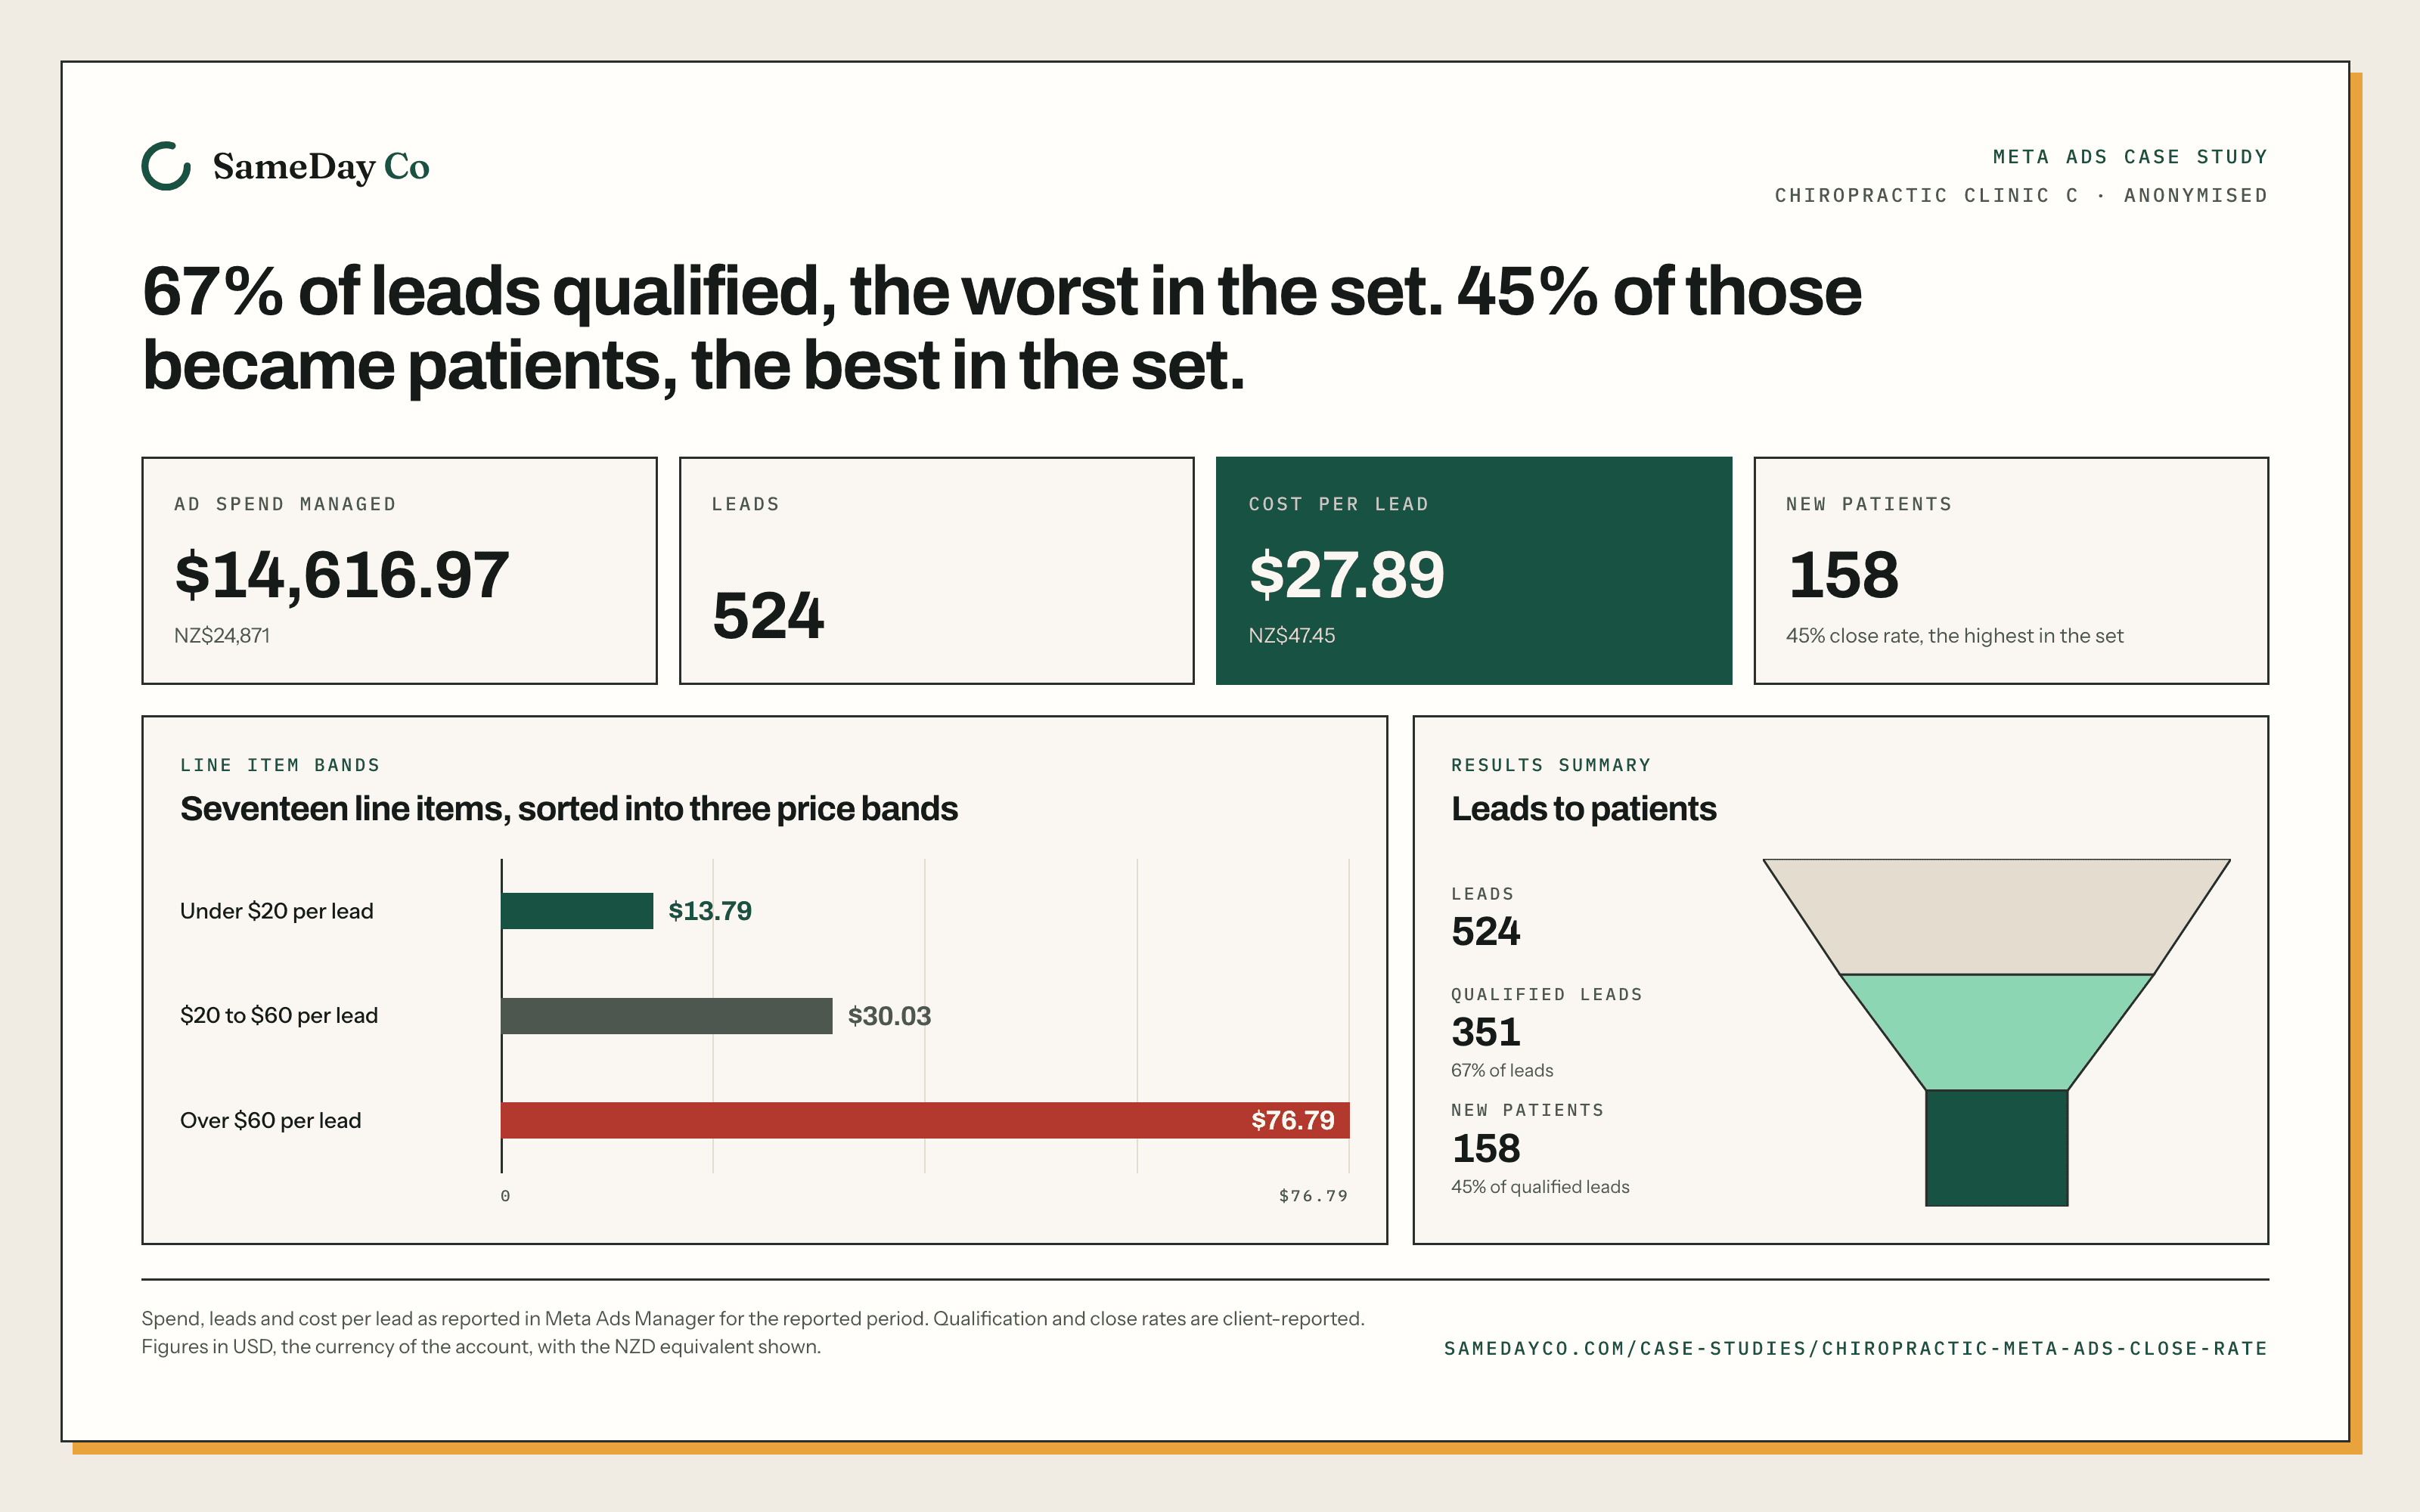
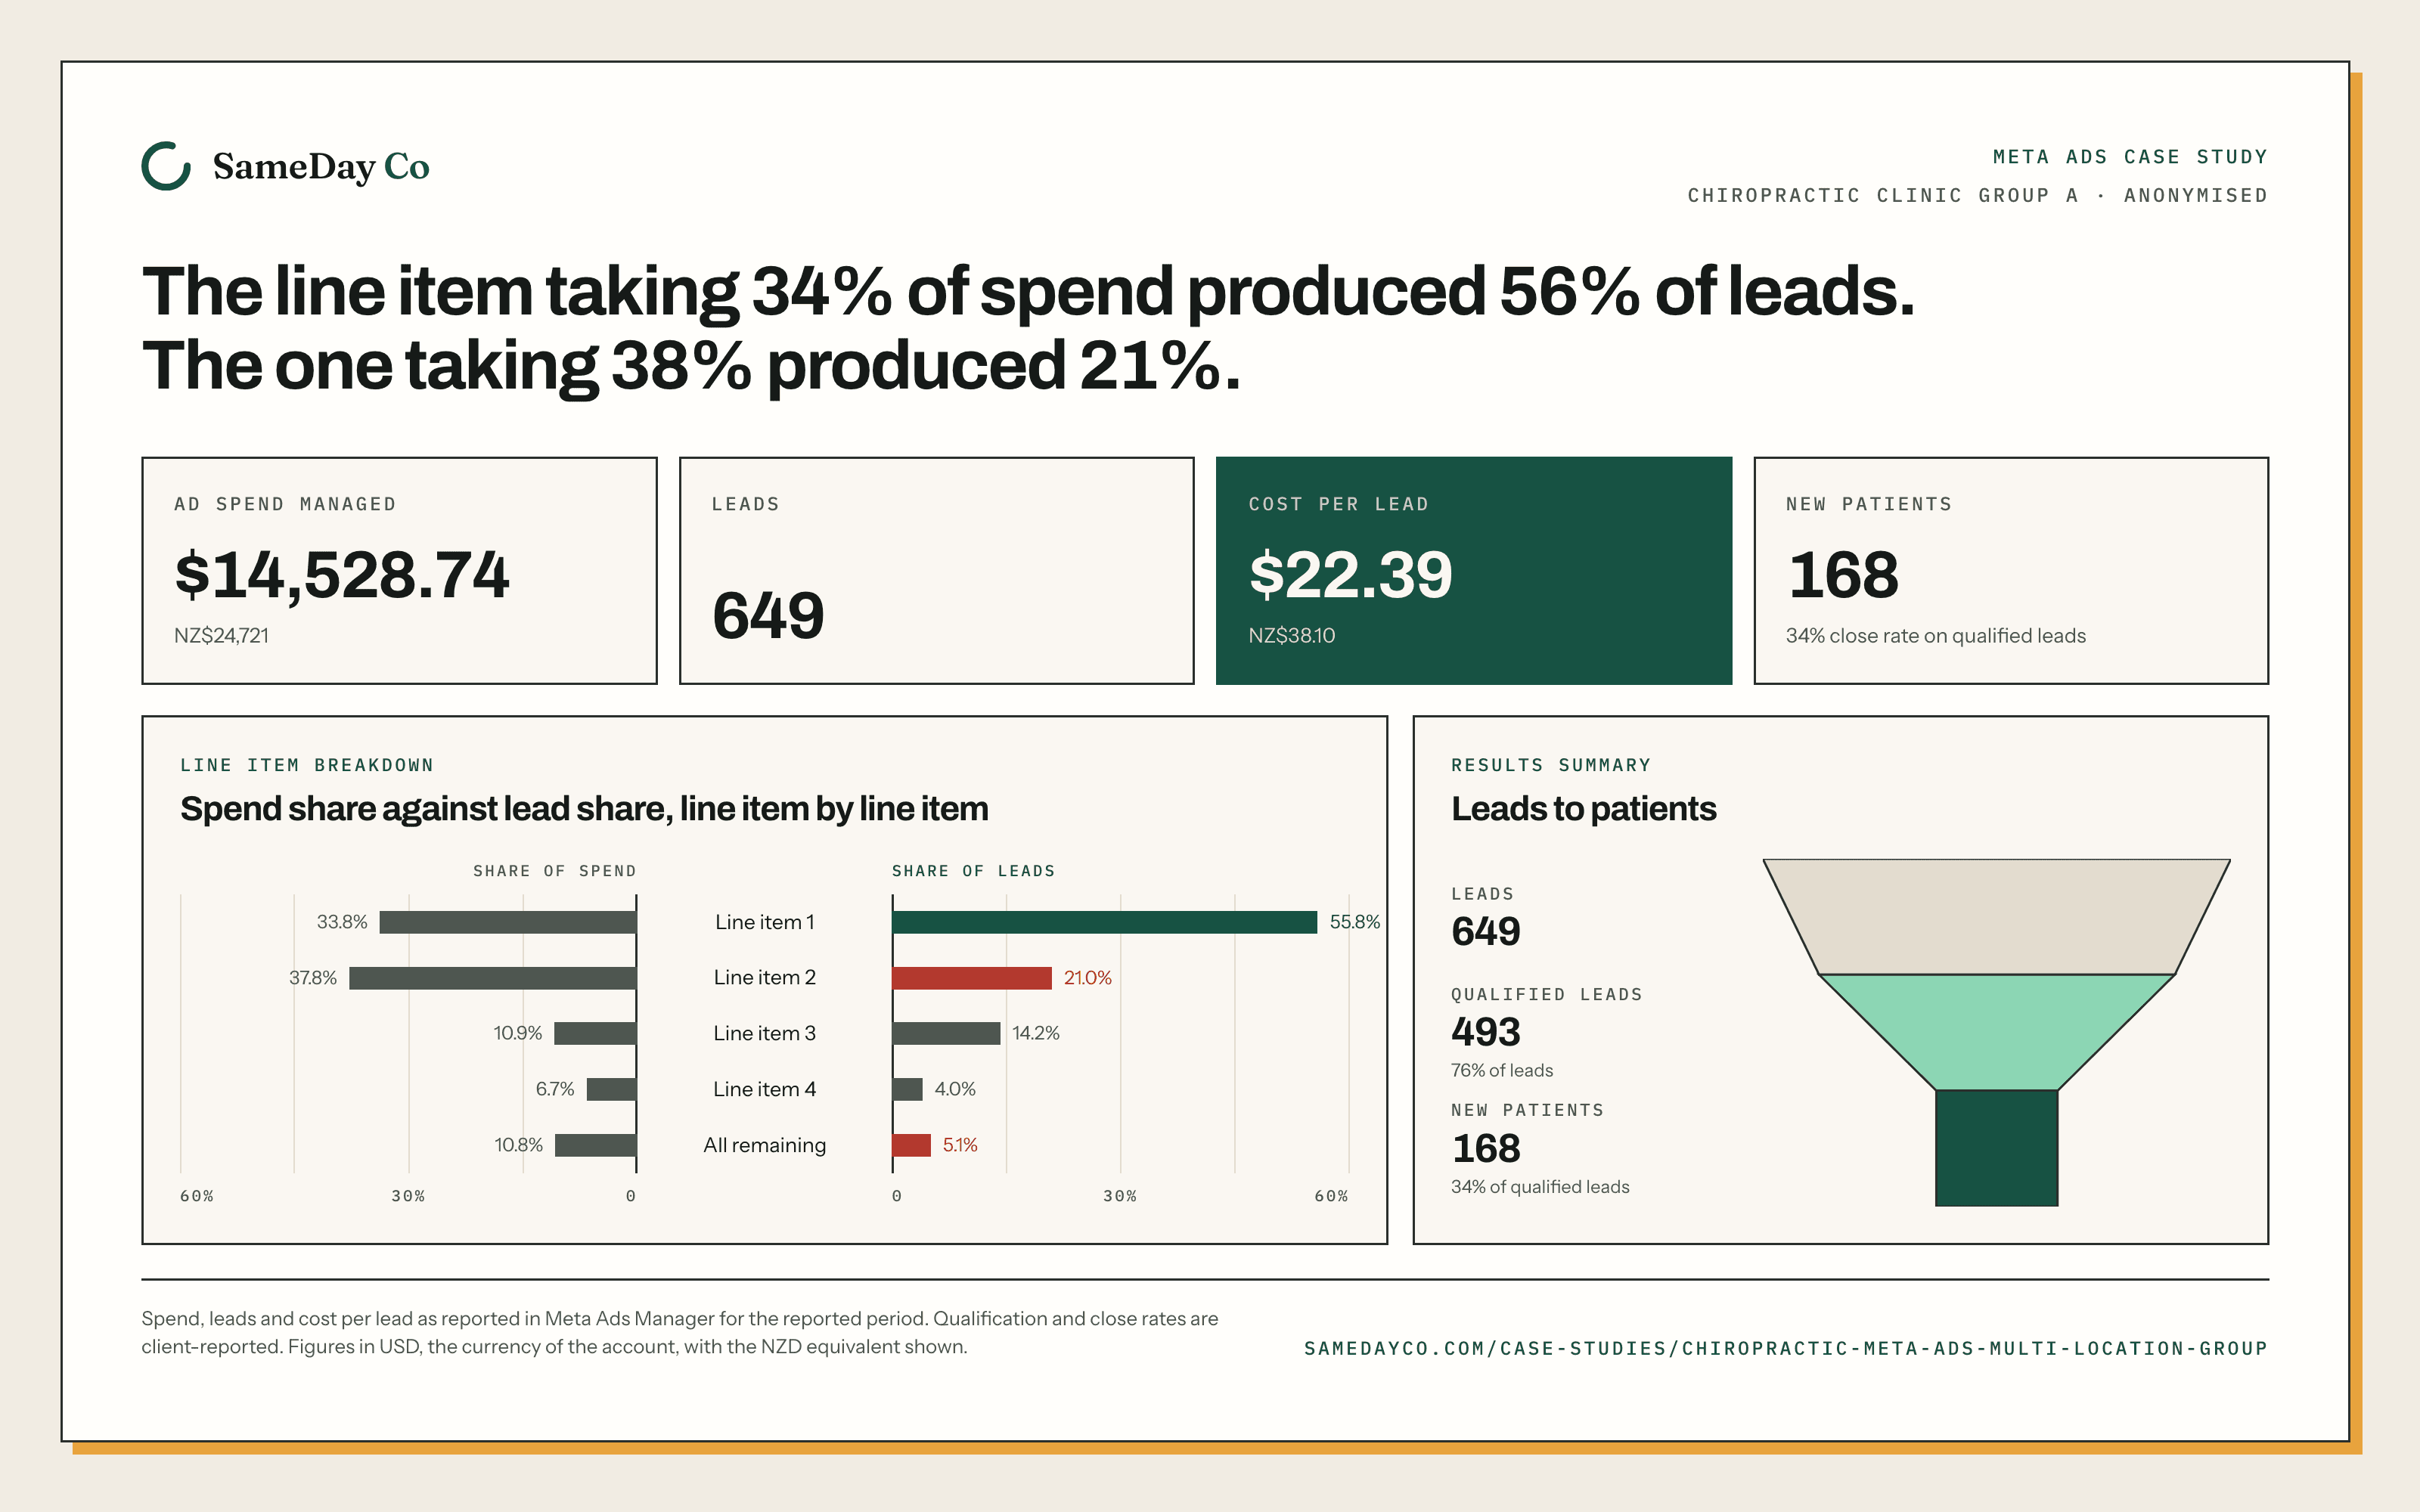
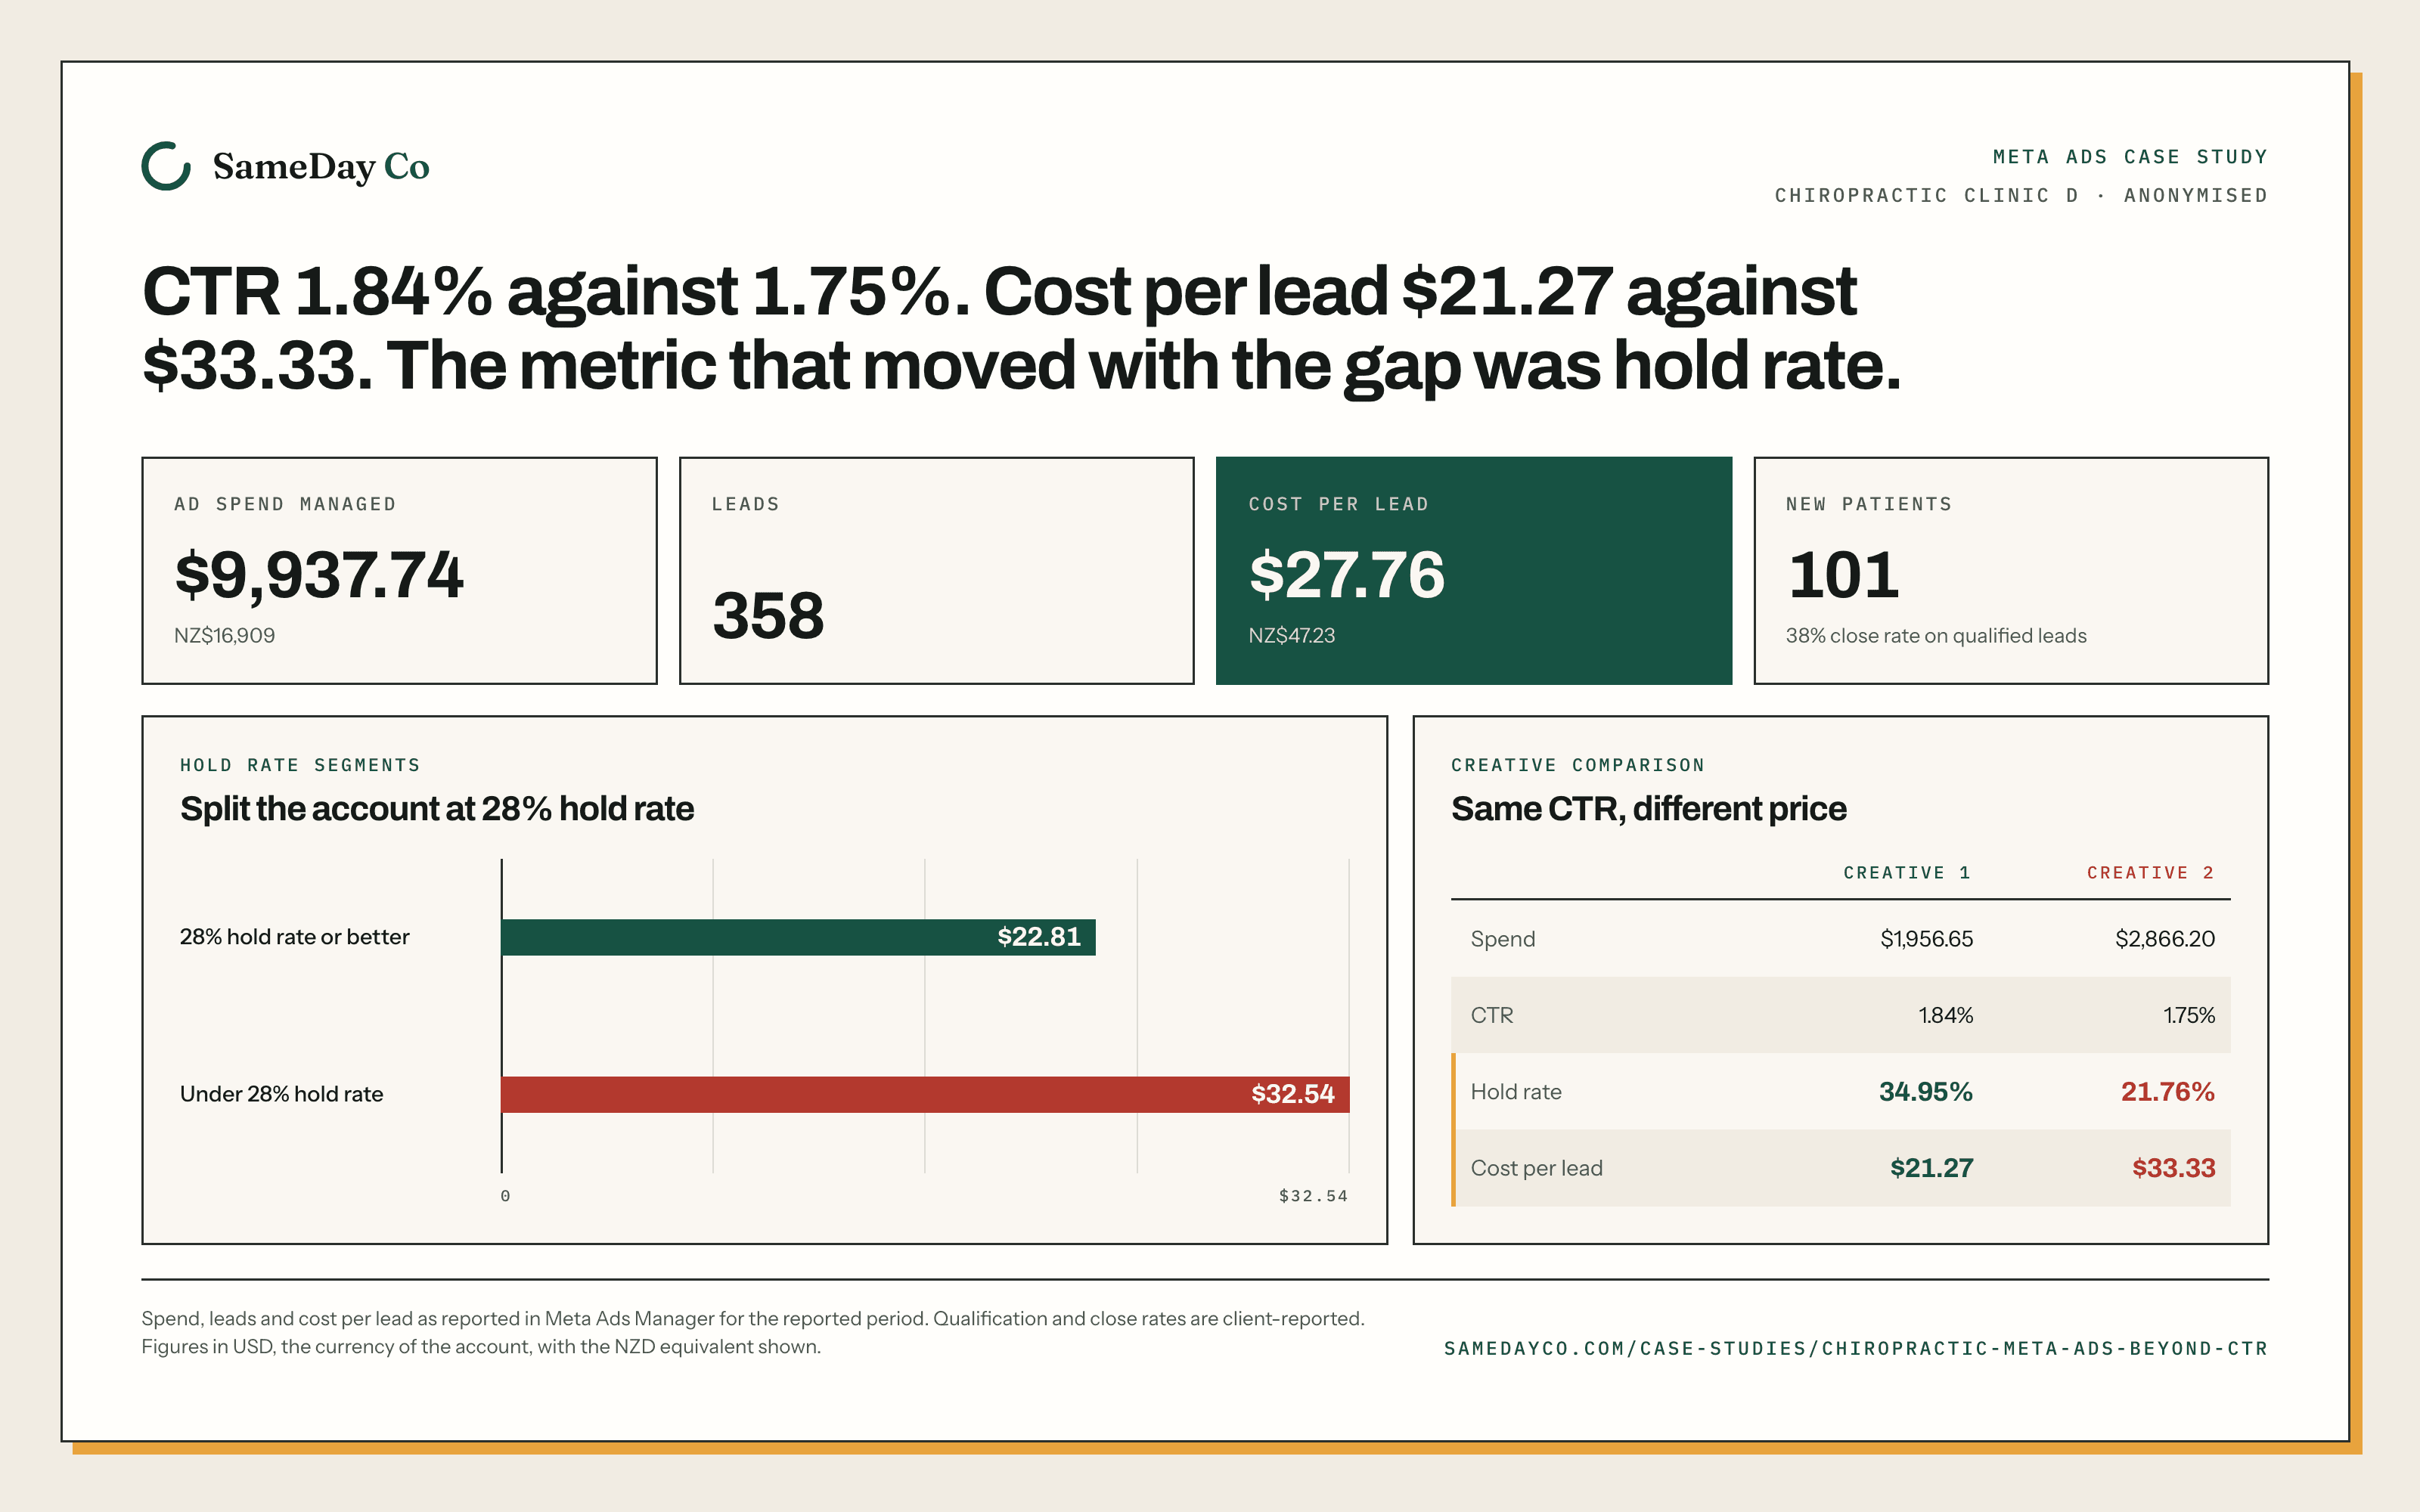
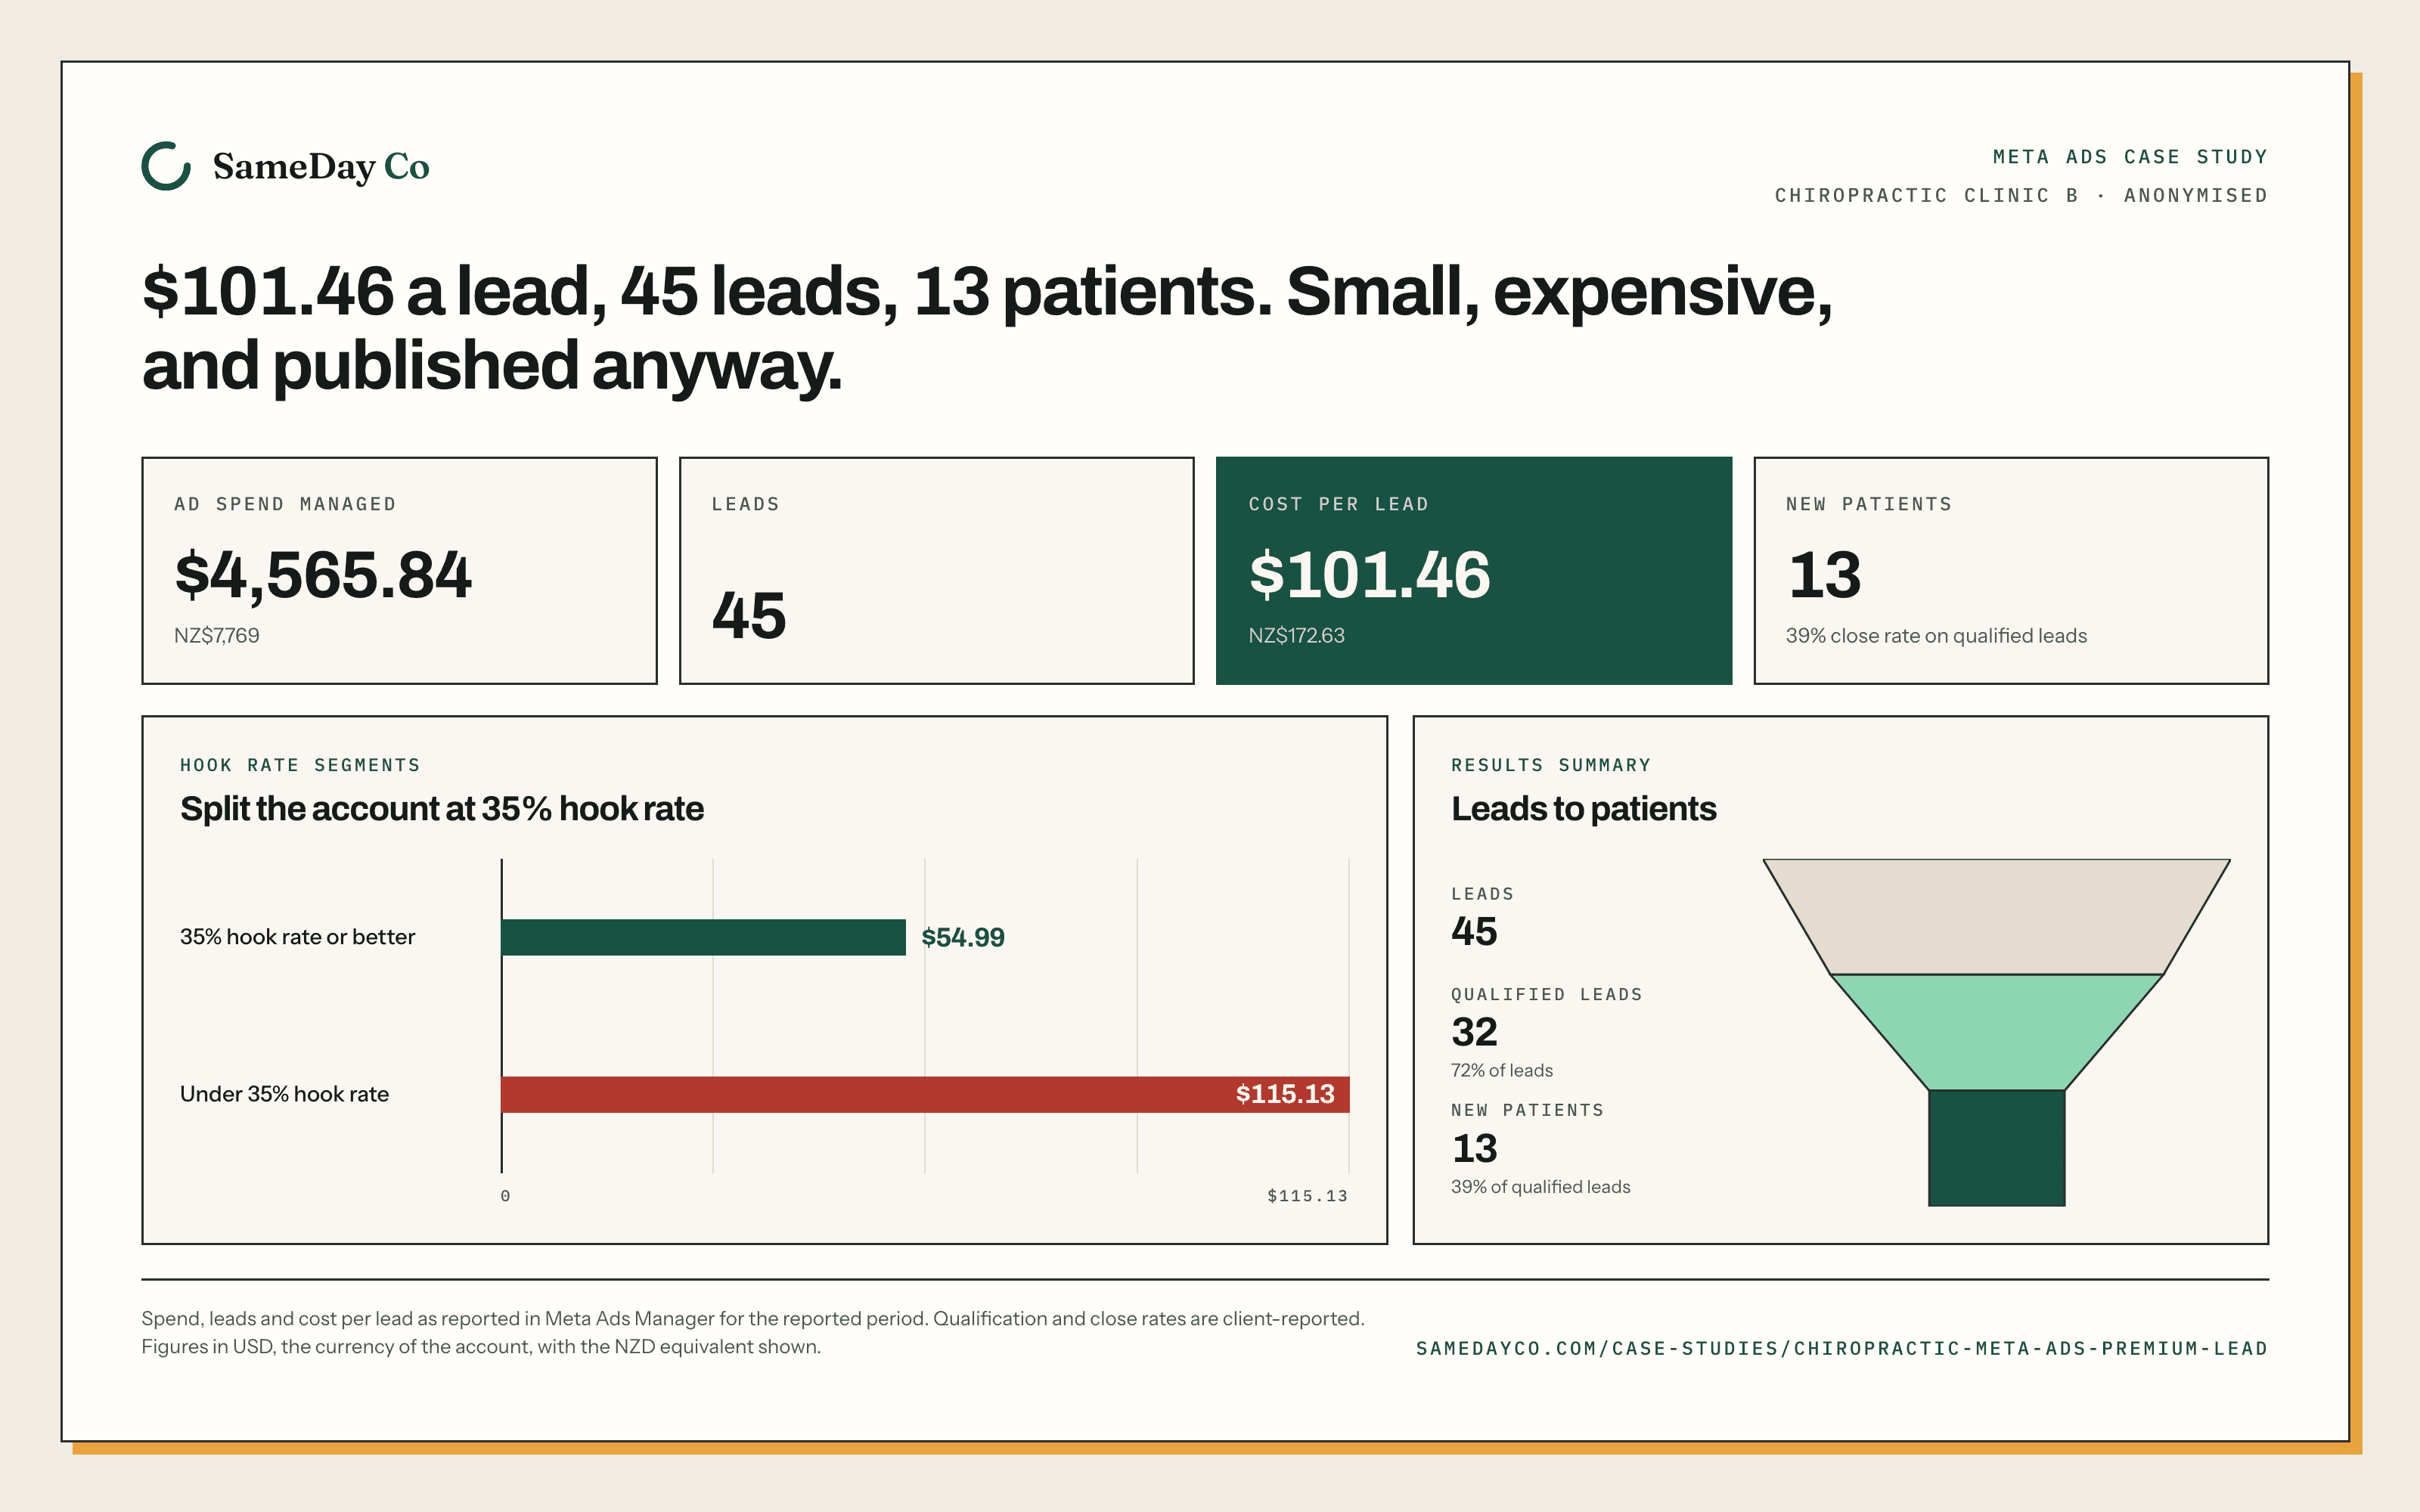
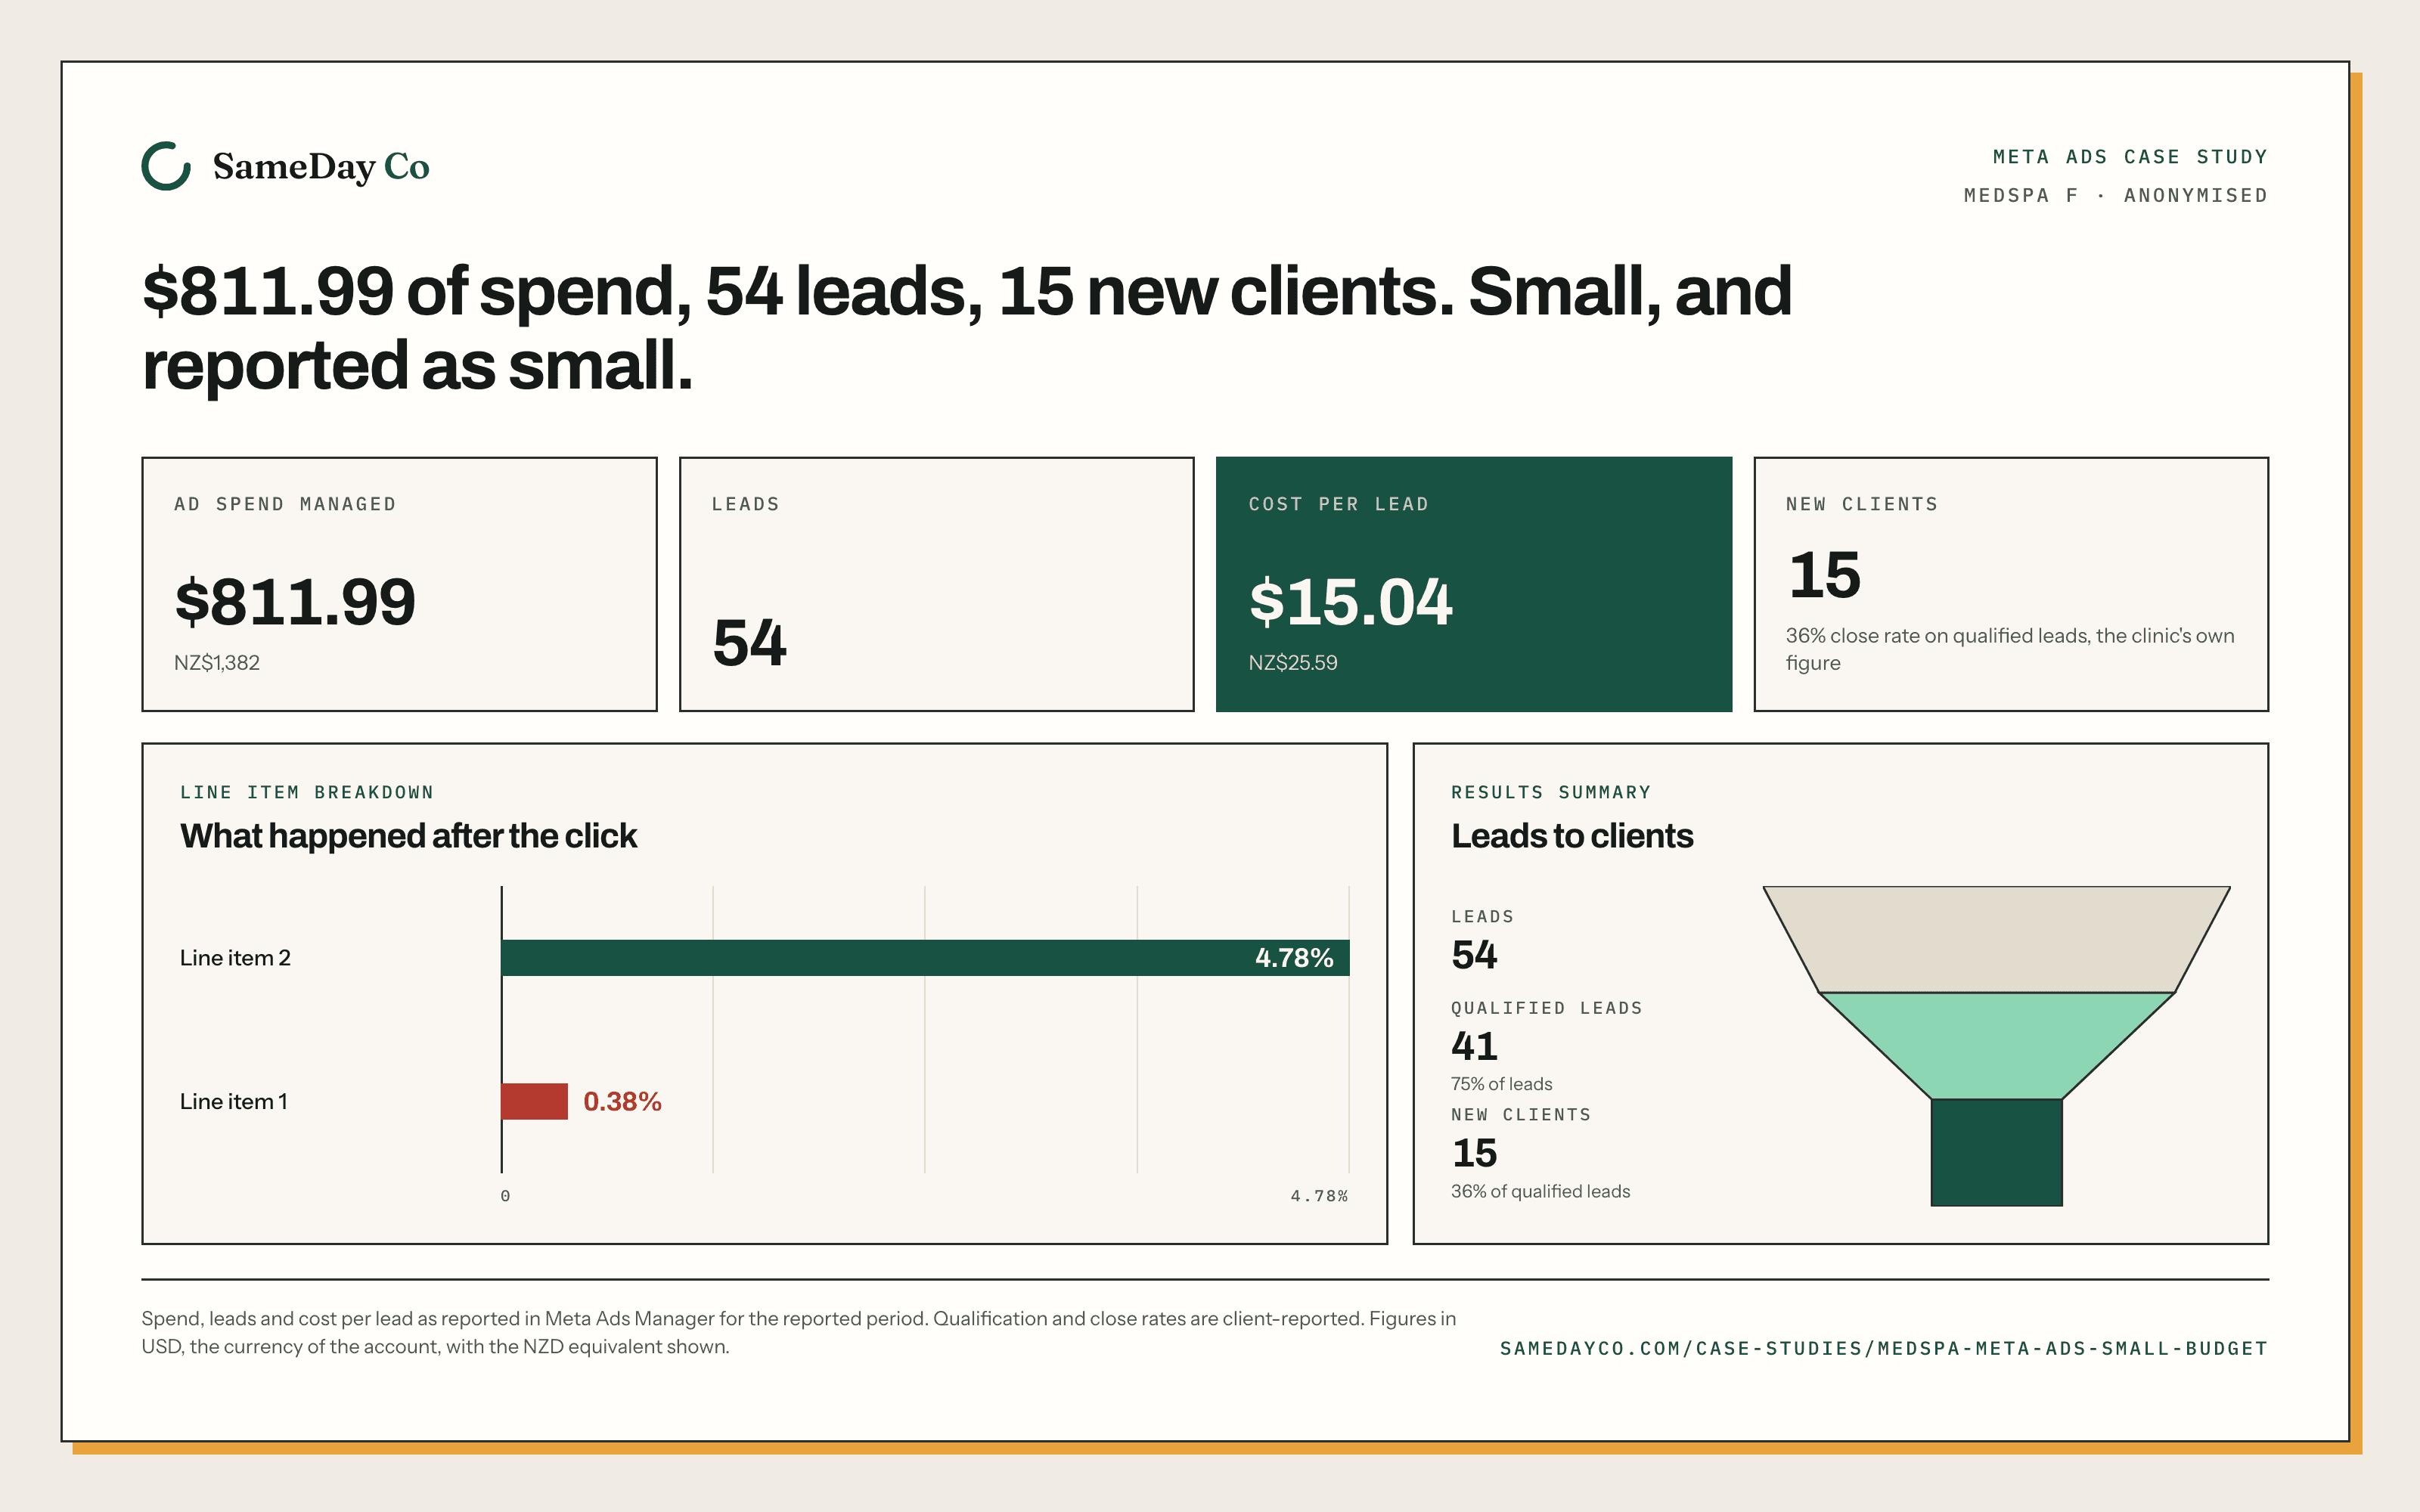
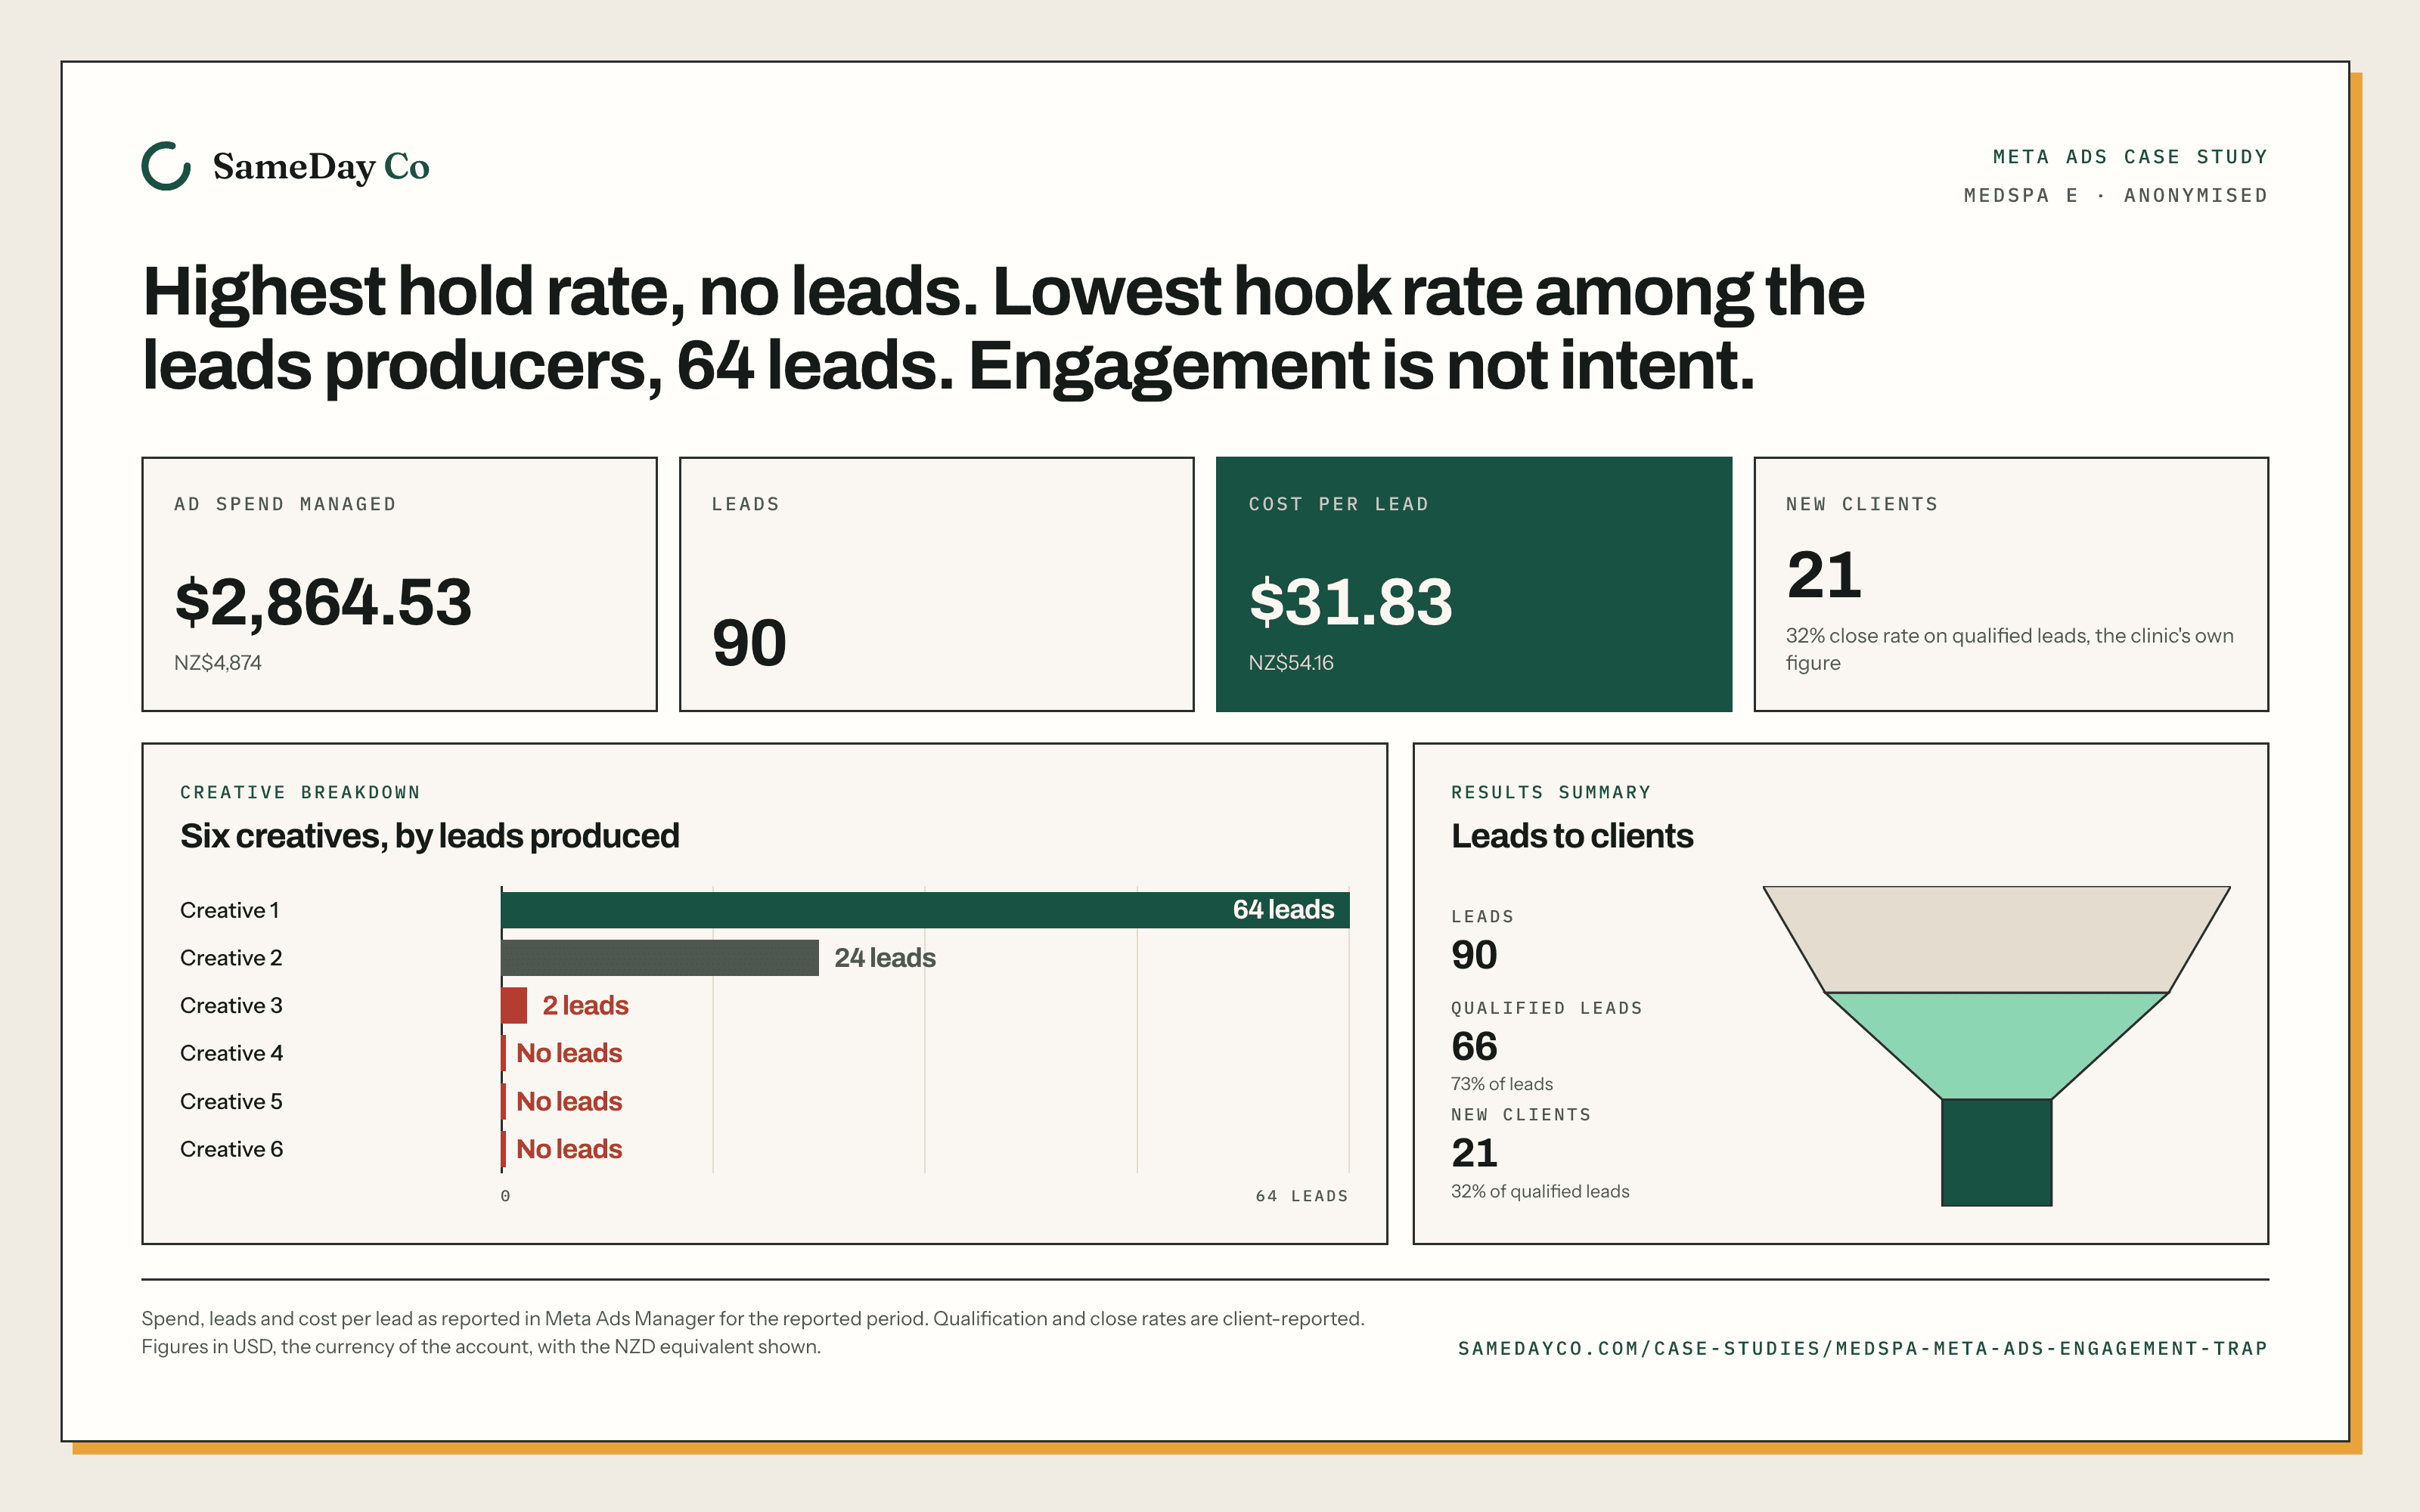
Spend, leads, cost per lead, clicks, CPM, CTR and the video engagement rates come from the Meta Ads platform export for the account, unmodified. Two figures per account do not: the qualification rate and the close rate are the clinic's own, reported from their records. The qualified-lead and patient counts are then derived from those two rates, leads multiplied by the qualification rate and that figure multiplied by the close rate, rounded once for publication. They are arithmetic on a reported rate rather than a headcount, and nothing on these pages should be read as a person-by-person audit of a clinic's patient records.
The clinic is anonymised and the market is not named. What transfers to a New Zealand clinic is the method and the shape of the cost, not the cost itself: auction prices move with the market, the season and the offer. Treat every dollar figure here as evidence of how the account was run, not as a price you should expect.
Everything published here is lower funnel: leads, qualified leads, patients, and the cost of each. Reach, impressions, engagement and video views appear only as diagnostics, and never as a result. An account that bought a great deal of attention and no patients is a failed account.
These accounts were billed in United States dollars, so United States dollars are what this page reports. Each headline figure carries its New Zealand dollar equivalent underneath in smaller type, converted once at a fixed rate of 1 USD = 1.7015 NZD, taken from ExchangeRate-API open endpoint (open.er-api.com/v6/latest/USD) on 5 August 2026. It is not a live feed, and the real rate on the day any of this money was spent was different.
Qualified-lead and patient counts are not headcounts: leads are multiplied by the clinic's own reported qualification rate, then by its close rate, rounded once for display. That is why a spend divided by a lead count can land a cent or two off a published rate; cost per lead is the one figure that always divides exactly, and every total on this page is checked automatically at build time.
Totals across accounts work the other way. The portfolio and per-industry figures are sums of the whole-number counts published on each of the eight pages, so they reconcile exactly and the site refuses to build if they do not. What that checks is the arithmetic. The rates underneath it are the clinics'.
Three limits worth stating plainly. No account here ran in New Zealand, so nothing on this page forecasts what a New Zealand clinic will pay per lead. Eight accounts is enough to show a method and a pattern, not enough to support a rule. And nothing here is a clinical claim: these are advertising accounts, and no figure says anything about treatment or outcome.
+-Lead
A person who completed the form or the messaging flow the ad pointed at. Counted once.
+-Qualified lead
A lead the clinic judged worth booking: correct service, contactable, and not already a patient. The clinic makes that call, not the platform and not the agency.
+-New patient or new client
A qualified lead who attended and paid for a first appointment.
+-Cost per lead
Spend divided by leads, for the account and date range shown.
+-Leads per click
Leads divided by link clicks. The share of people who clicked and then actually completed the form. It is the metric CTR is most often mistaken for.
+-Form conversion rate
Leads divided by the number of people who opened the form. It separates a weak form from weak traffic.
+-Hook rate
A custom metric, not a column Meta ships by default. It is built in the ad account from Meta's three second video plays, which count plays rather than people and include autoplay, so a high hook rate is not evidence that anyone chose to watch. The formula behind the figures on these pages is not recorded in the account material this set was built from. A diagnostic for the first frame, not a result.
+-Hold rate
A custom metric, not a column Meta ships by default. It is built in the ad account from Meta's video watch figures and describes how far into a video the audience stayed. It scales inversely with video length, so a short clip reports a higher rate than a long one with no difference in quality, and the creative runtimes for these accounts are not recorded. A diagnostic for the edit, not a result.
+-Frequency
Average number of times the same person saw the ad over the date range. Rising frequency on a flat budget usually means the audience is exhausted.
+-CPM
Cost per thousand impressions. An auction price, not a performance measure.
+-CTR
Click-through rate: clicks divided by impressions. Appears here only where it contradicts the cost, which is most of the time.