Chiropractic clinic D
Two creatives with the same CTR and a 57% gap in cost per lead
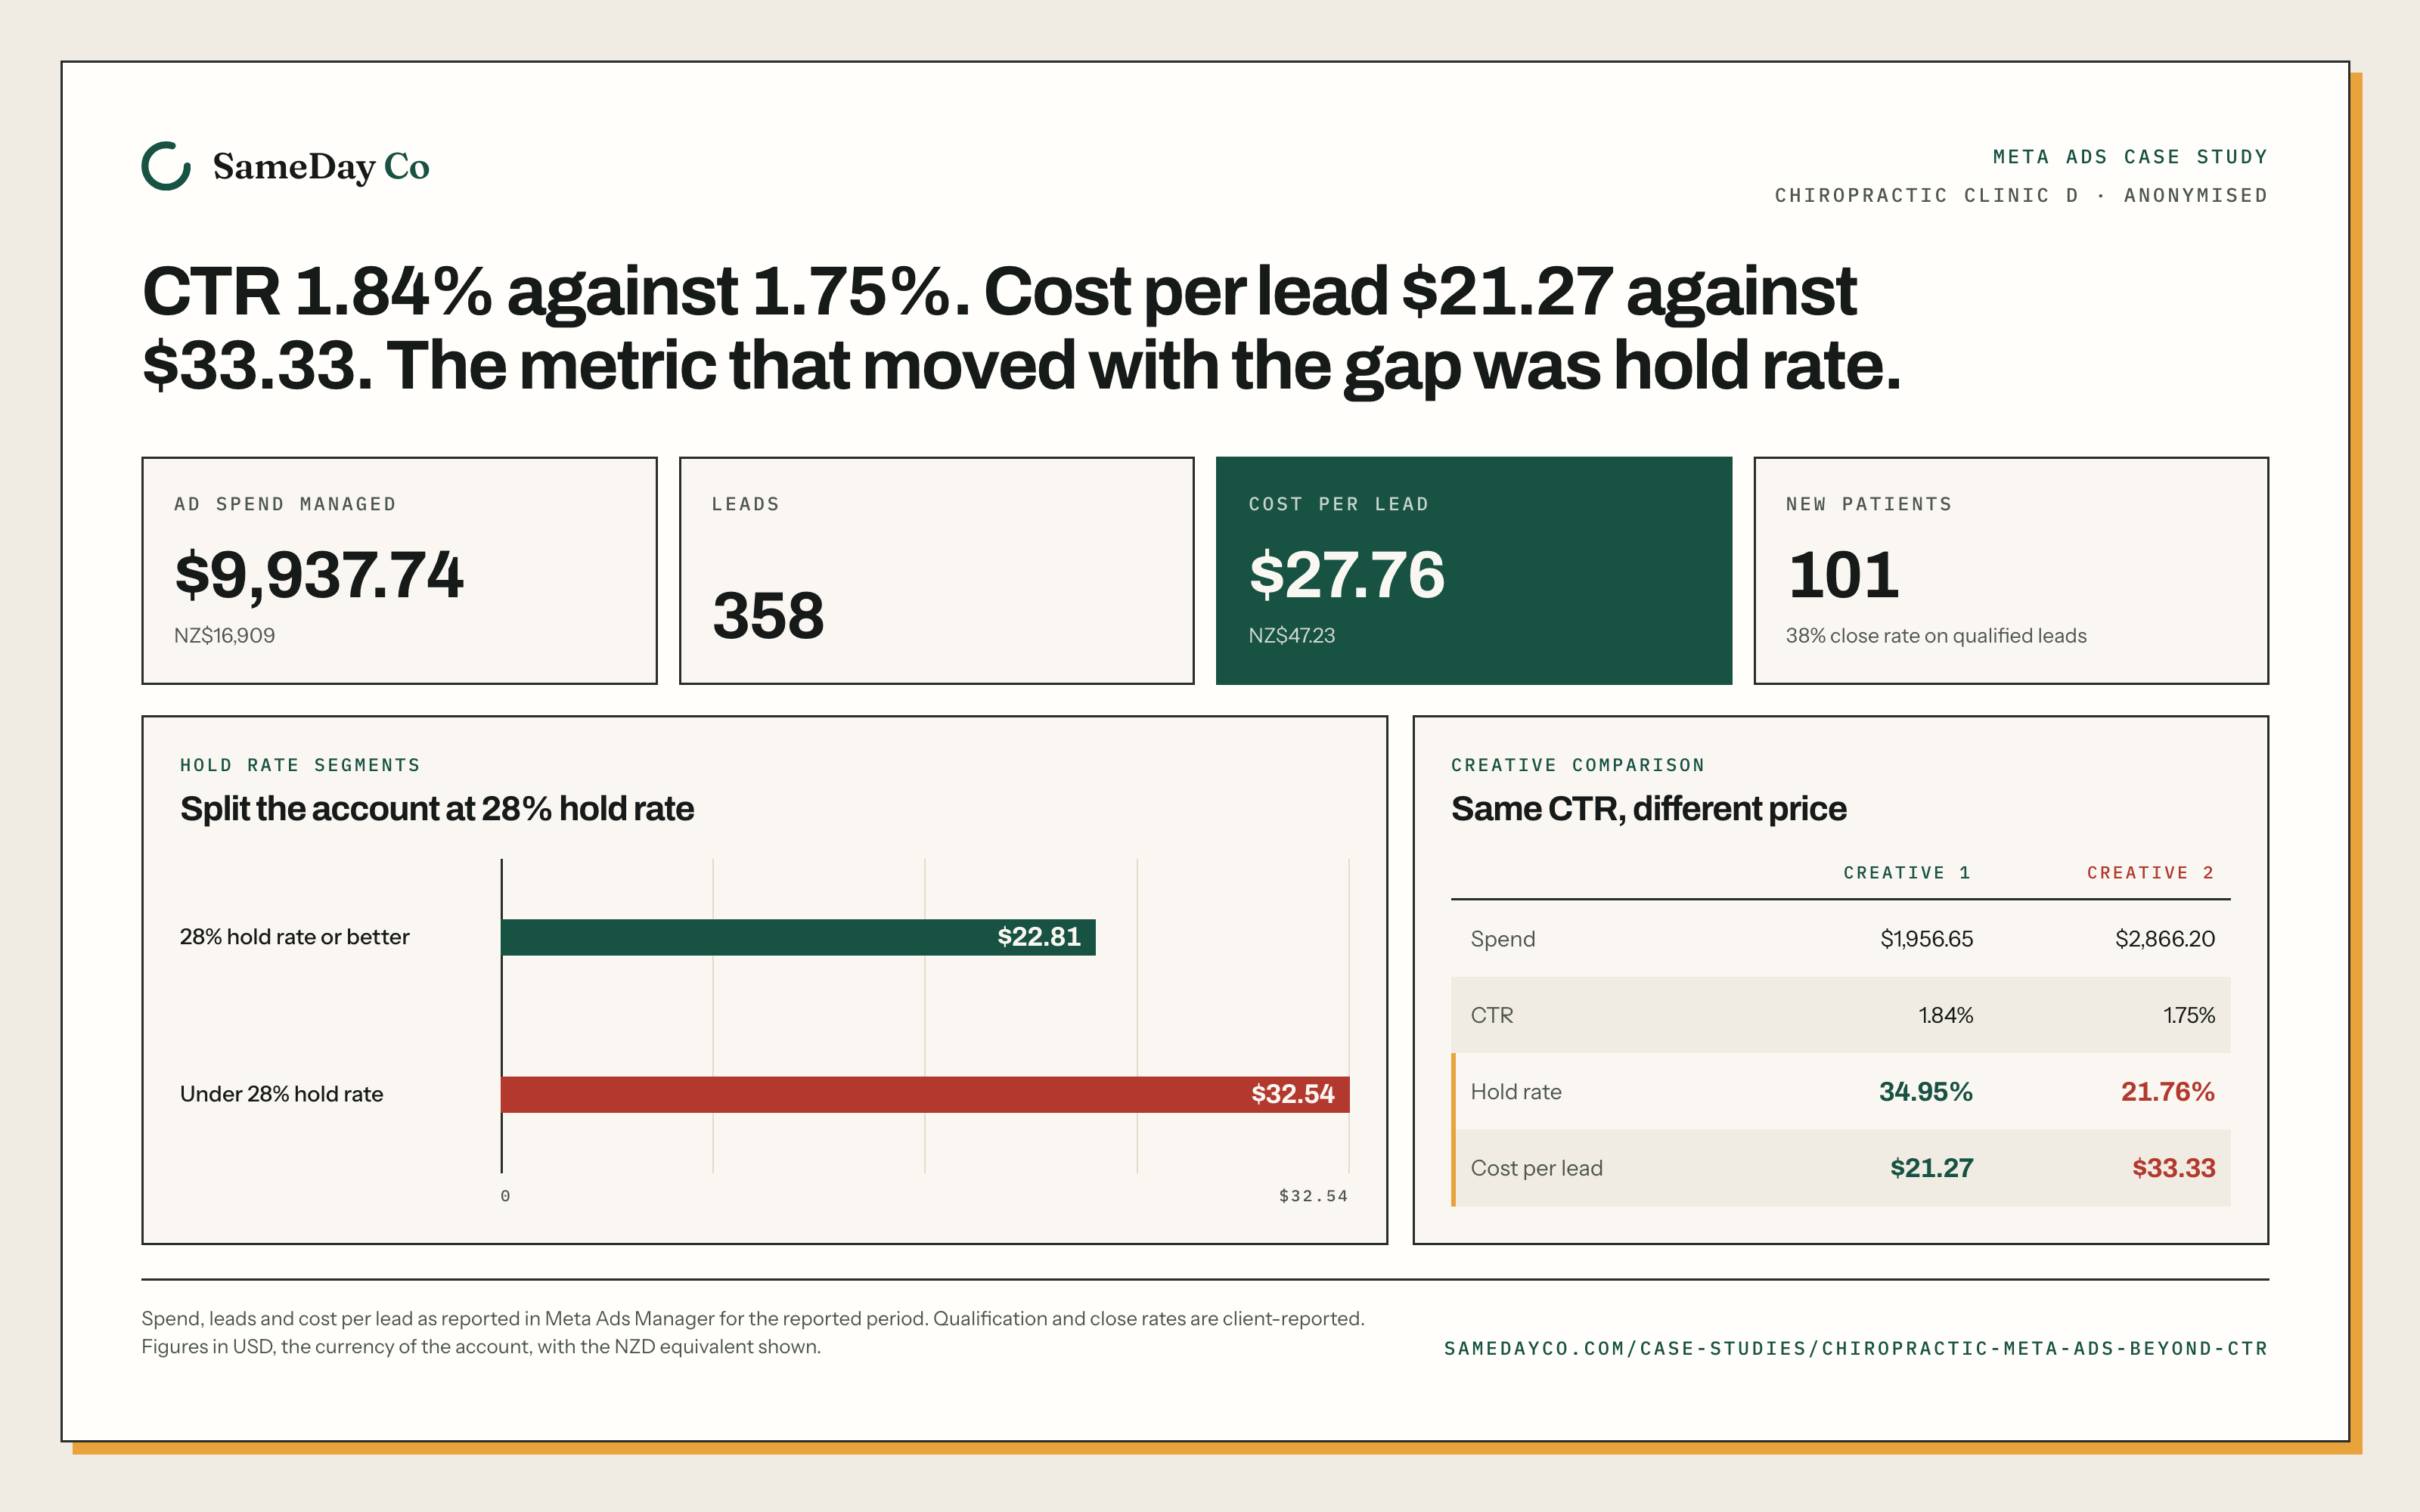
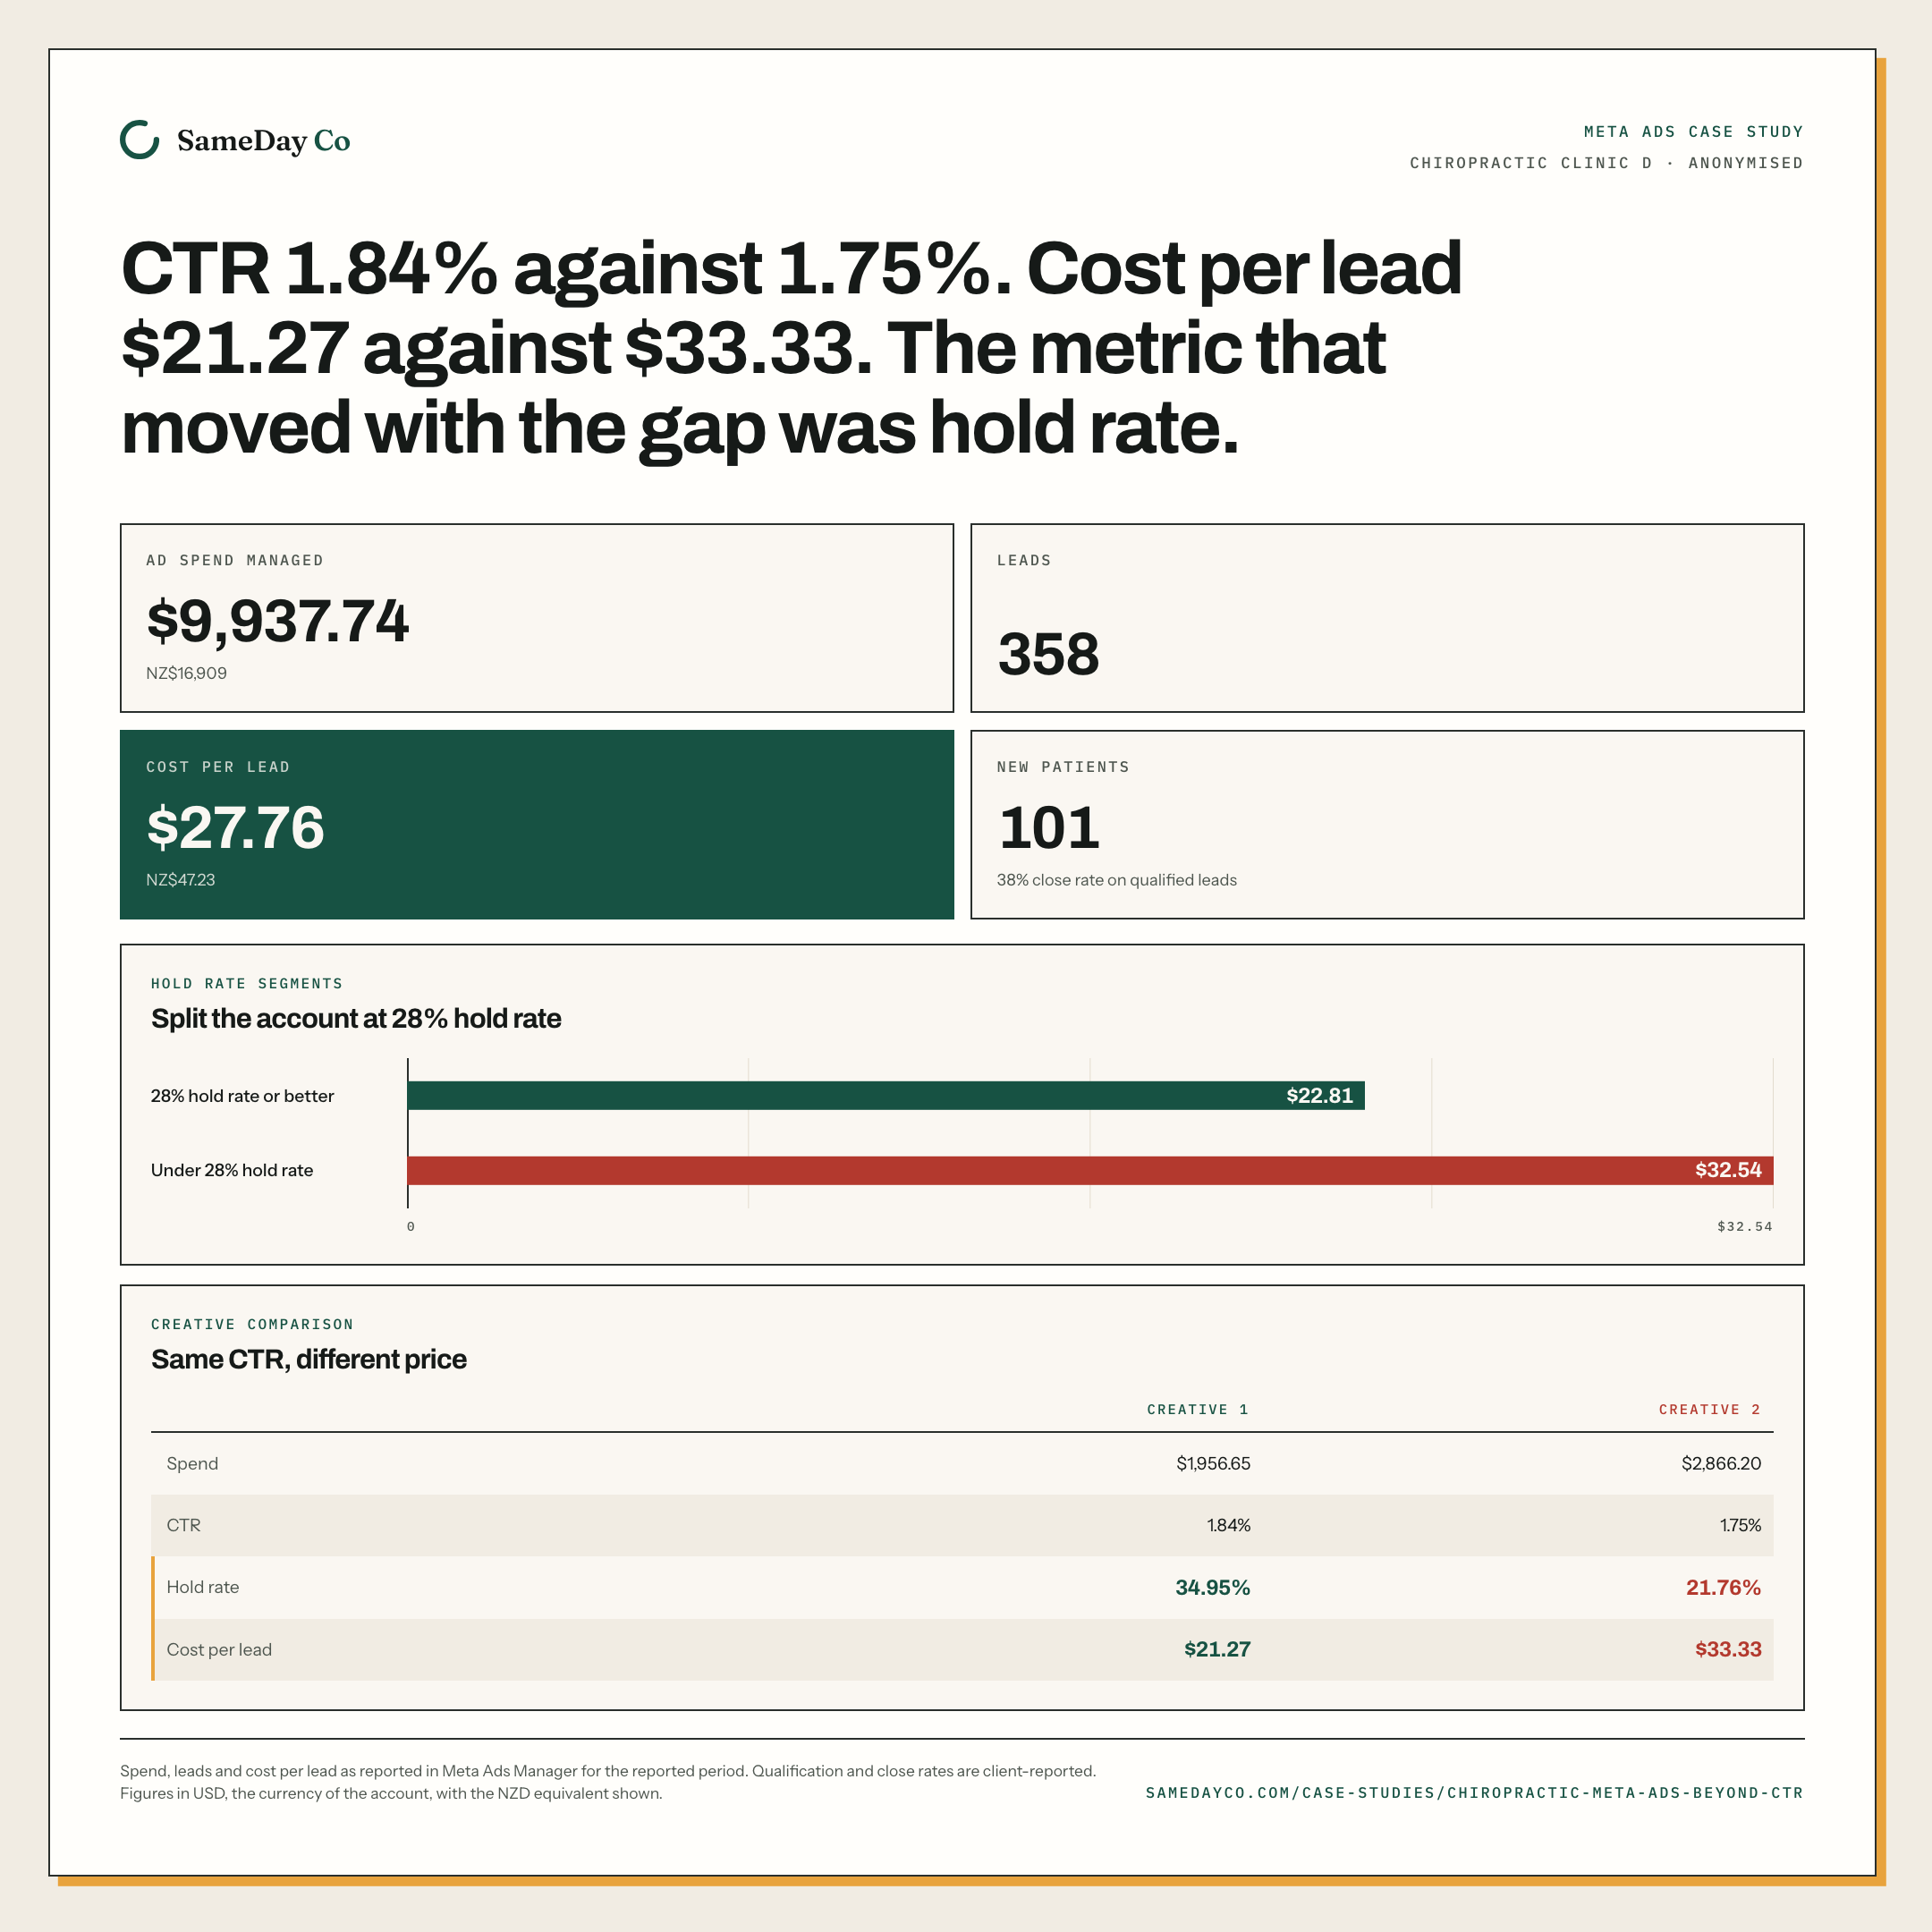
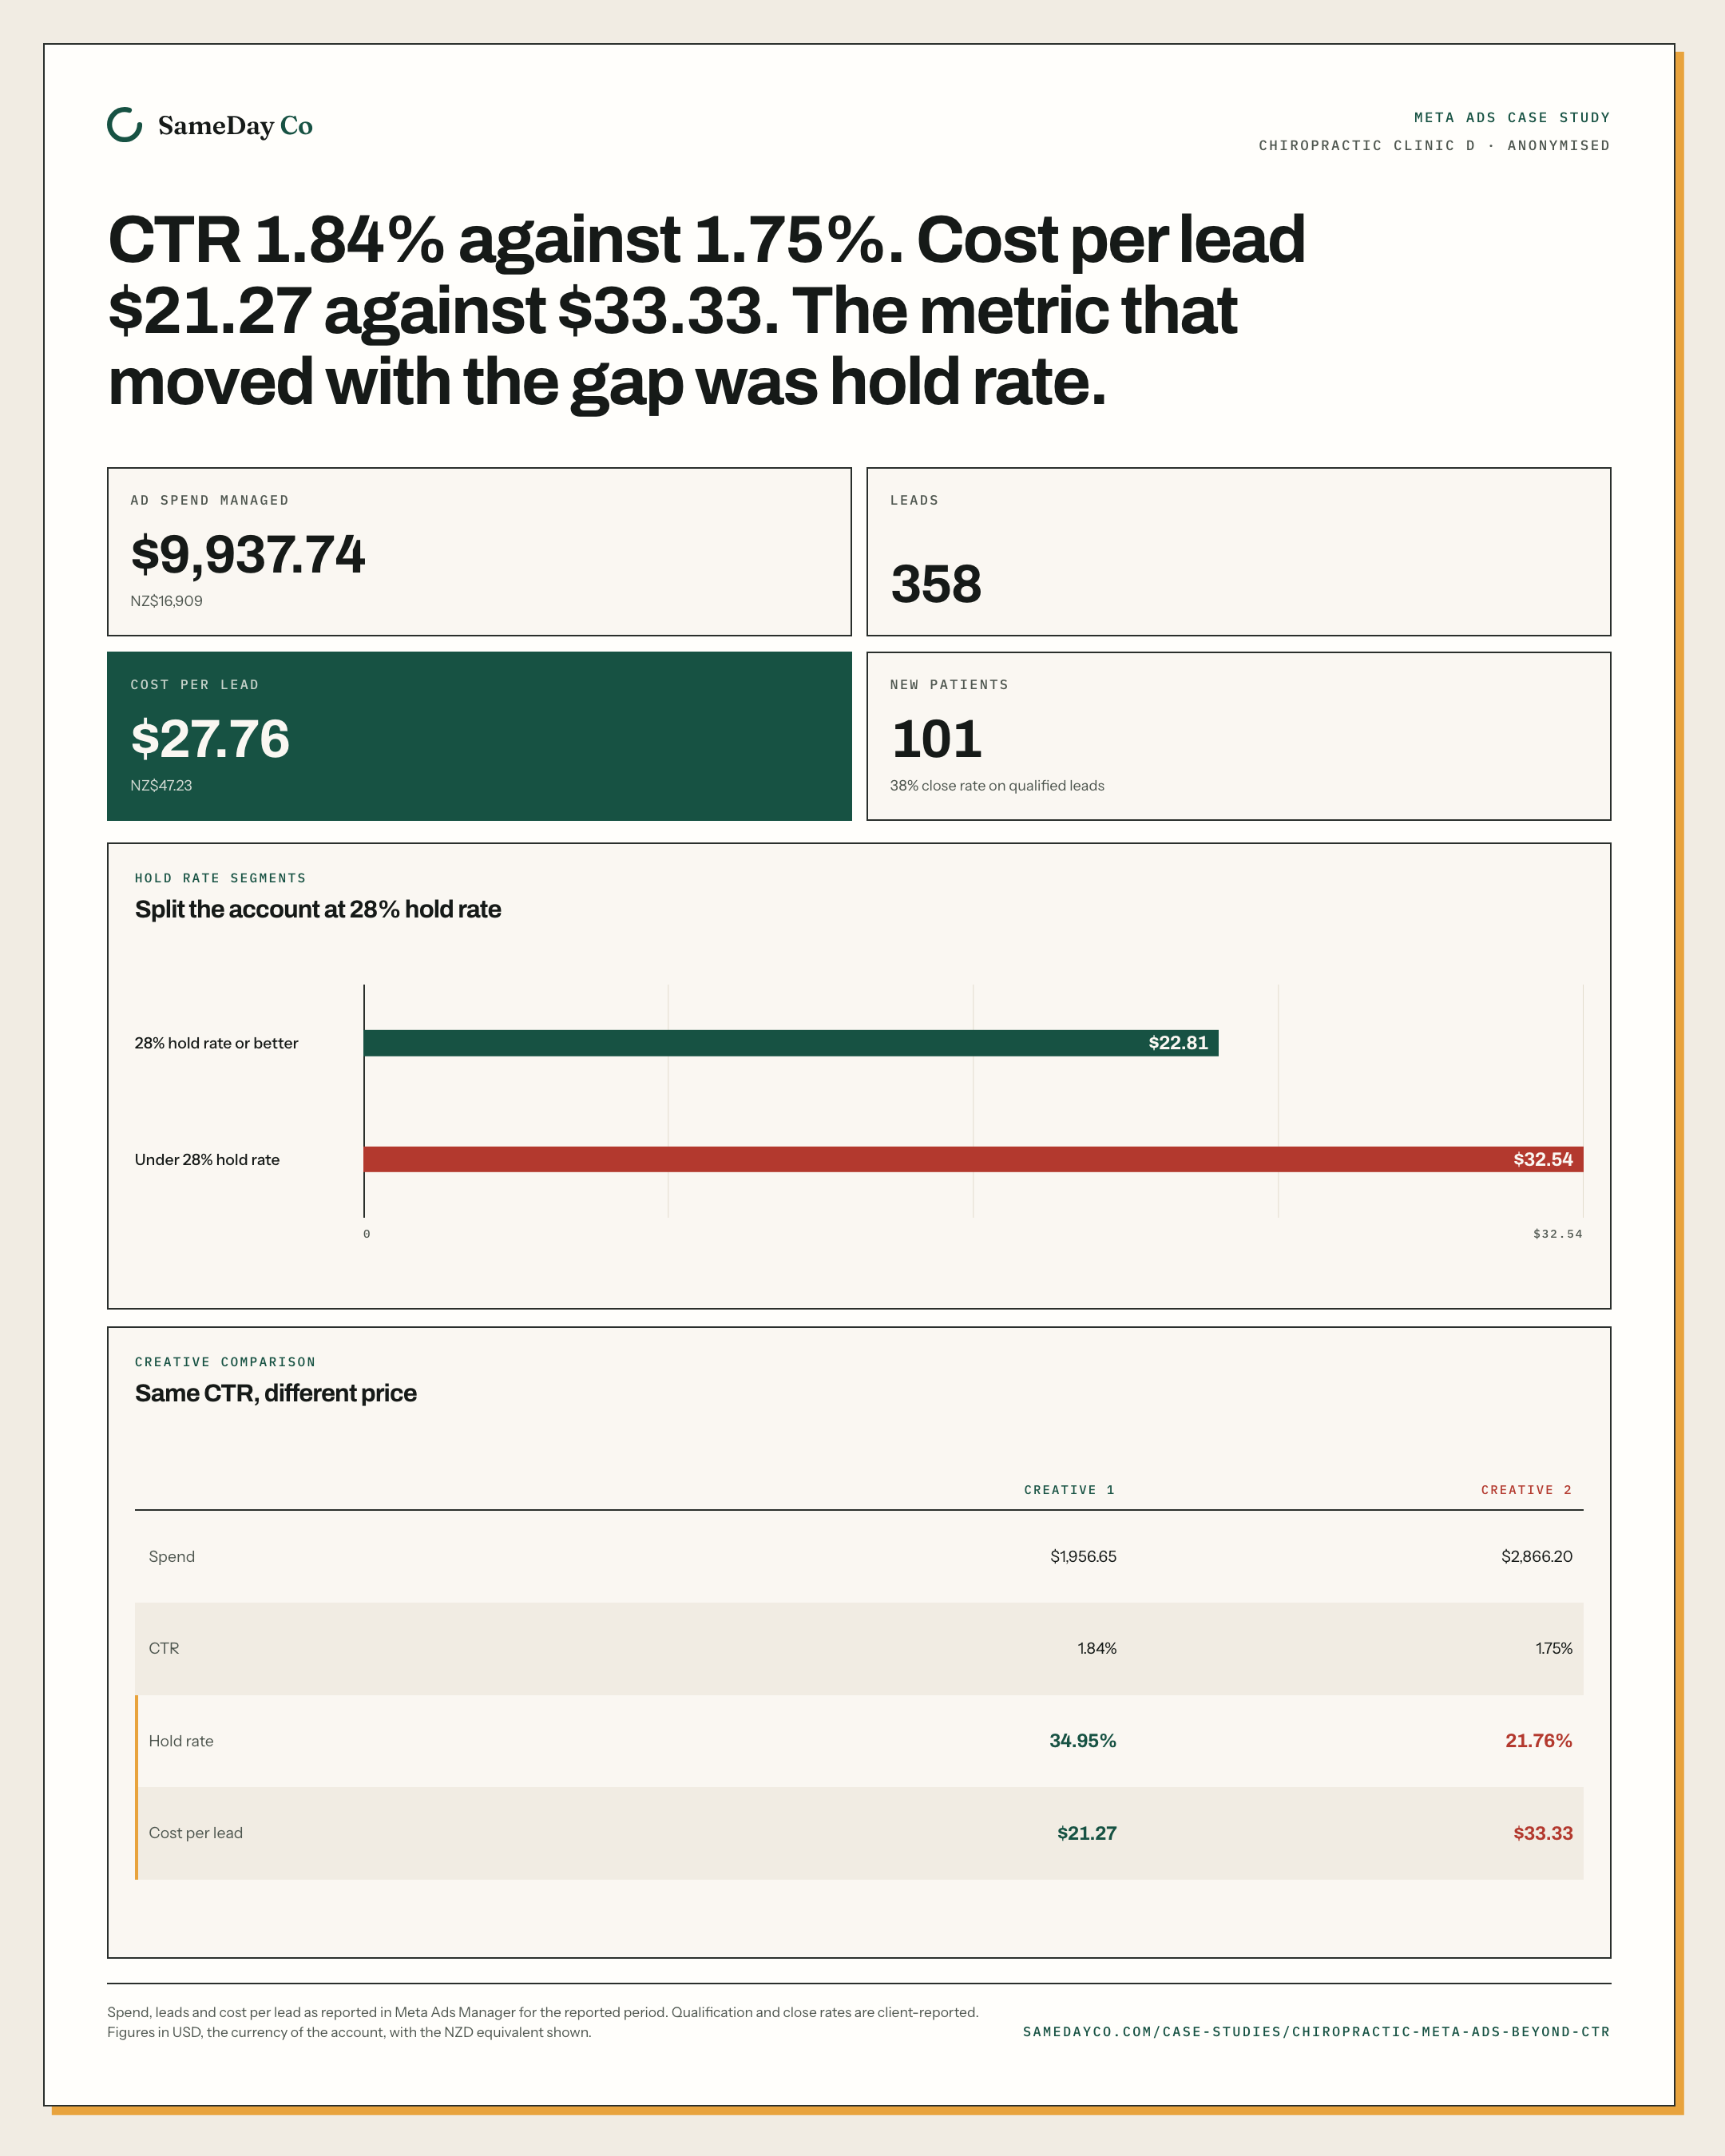
Two creatives in this account had all but the same click-through rate, 1.84% against 1.75%. One produced leads at $21.27 and the other at $33.33, a 57% difference in what a lead cost. What tracked the gap was hold rate, how far into the video people stayed, which is not the metric most reports lead with.
Chiropractic · US$9,937.74 · Published 2026-08-05
The numbers
What the account actually did.
Figures are as recorded in the platform export for this account. United States dollars as spent, New Zealand dollars underneath at the rate on the methodology page.
- Ad spend managed
- $9,937.74NZ$16,909
- Leads
- 358
- Cost per lead
- $27.76NZ$47.23
- Qualified leads
- 26574% of leads
- New patients
- 10138% close rate on qualified leads
- Cost per new patient
- $98.72NZ$167.97
Hold rate falls as video length rises: a short clip reports a far higher hold rate than a long one with no difference in quality. The runtimes behind the creatives in this account have not been pulled or normalised, so every hold rate below should be read with that in mind. This caveat is scoped to hold rate. It does not extend to the click-through rates or to the lead counts elsewhere on this page.
Download this account as an image
The contradiction
Hold rate correlated with cost per lead at -0.665. CTR separated the two creatives by 0.09 of a percentage point.
01
What the account was
This chiropractic account ran $9,937.74 of Meta Ads spend across 358 leads over the reported period, at a blended $27.76 cost per lead. The exact campaign window is still being confirmed against the platform export.
The clinic is anonymised throughout, and the market it operated in is not stated. Video was the primary creative format, and the account's shape is what this page is about: two creatives with almost the same click-through rate and a 57% gap in what a lead cost.
02
Same click-through rate, different price
Creative 1 spent $1,956.65 at a 1.84% CTR, a 34.95% hold rate, and a $21.27 cost per lead. Creative 2 spent $2,866.20 at a 1.75% CTR, a 21.76% hold rate, and a $33.33 cost per lead. The click-through rates were near-identical. The cost per lead was not.
Judged on CTR alone, these two creatives look interchangeable, and the larger budget had in fact gone to the more expensive one. The metric that tracked the price gap was hold rate, how far into the video people actually stayed.
The decision rules below were derived from this account's data after the fact. They were not a documented process running at the time, and they are stated here as what the numbers support, not as a method that was followed.
Chiropractic clinic D, creative comparison
Same CTR, different price
Same CTR, different price. Comparing Creative 1 against Creative 2. Spend: $1,956.65 against $2,866.20. CTR: 1.84% against 1.75%. Hold rate: 34.95% against 21.76%. Cost per lead: $21.27 against $33.33.
| Measure | Creative 1 | Creative 2 |
|---|---|---|
| Spend | $1,956.65 | $2,866.20 |
| CTR | 1.84% | 1.75% |
| Hold rate | 34.95% | 21.76% |
| Cost per lead | $21.27 | $33.33 |
Leads and form conversion are not shown: the export does not separate them for Creative 2, and a figure that cannot be separated should not be published as if it could.
03
Hold rate against cost per lead
Across the account's nine line items with meaningful spend, hold rate correlated with cost per lead at -0.665. Negative means the two moved in opposite directions: line items with a higher hold rate tended to record a lower cost per lead.
Correlation is not cause, and nine line items in one account over one period is not a controlled test. What it does show is that the metric that moved with the gap between the two creatives above was not the one most reports lead with.
Chiropractic clinic D, correlation table
Hold rate against cost per lead
Hold rate against cost per lead. Hold rate: correlation -0.665. n = 9 line items. Correlation is not cause.
- Hold rate-0.665-10+1
Higher hold rate, lower cost per lead
n = 9 line items. Correlation is not cause: these are relationships inside one account, not laws.
Correlation is not cause, and nine line items is nine line items. What it does show is that the metric separating these two creatives was not the one on the front of the report.
04
Split the account at 28% hold rate
Nine line items, covering $9,380.20 of the $9,937.74 total, split into two bands at a 28% hold rate. Five line items at 28% or above spent $4,402.32 and produced leads at $22.81. Four line items below 28% spent $4,977.88 and produced leads at $32.54; leads in the better band cost roughly 30% less, and the line the bands were split on was how far into the video people stayed, not the click.
Hold rate is the earlier signal in this account: it is readable within days, long before a cost per lead has enough leads behind it to be trusted.
Chiropractic clinic D, hold rate segments
Split the account at 28% hold rate
Split the account at 28% hold rate. Bars are United States dollars. 28% hold rate or better, $22.81. Under 28% hold rate, $32.54.
- 28% hold rate or better$22.81
5 line items, $4,402.32 spent
- Under 28% hold rate$32.54
4 line items, $4,977.88 spent
Nine line items, covering $9,380.20 of the $9,937.74 total. Leads in the better band cost roughly 30% less, and the line the bands were split on was how far into the video people stayed.
05
What transfers to a New Zealand clinic
The method, not the price. Judge a video creative by hold rate before judging it by click-through rate. A near-identical CTR told this account nothing about which creative to fund, and the account had already got that call backwards once.
The 57% gap in cost per lead and the -0.665 correlation are this account's own numbers, not a benchmark. What transfers is the practice of checking hold rate before scaling a video creative on click-through rate alone.
More
Other chiropractic accounts.
- US$14,616.97The lowest qualification rate in the set, and the highest close rate67% of leads qualified, the worst in the set. 45% of those became patients, the best in the set.
- US$14,528.74One shared budget, and the line item taking 38% of itThe line item taking 34% of spend produced 56% of leads. The one taking 38% produced 21%.
- US$4,565.84The most expensive leads in the set, and what they were worth$101.46 a lead, 45 leads, 13 patients. Small, expensive, and published anyway.
Case studies reflect specific clinics and circumstances. Outcomes depend on market, budget, competition, clinic capacity, reception follow-up, timing and account history. Figures are historical examples, not typical-results claims, forecasts or guarantees.

The free Ad Check
Two written pages on your clinic's advertising. Free.
Your ads, site and Google profile wording, reviewed against your profession's advertising rules, the ASA Therapeutic and Health Advertising Code and the Fair Trading Act. In your inbox within two NZ business days. No call, no follow-up sequence, no obligation.
Free · Async · Two NZ business days