Dental practice G
Cheap clicks, expensive patients: a US$16,206 dental account
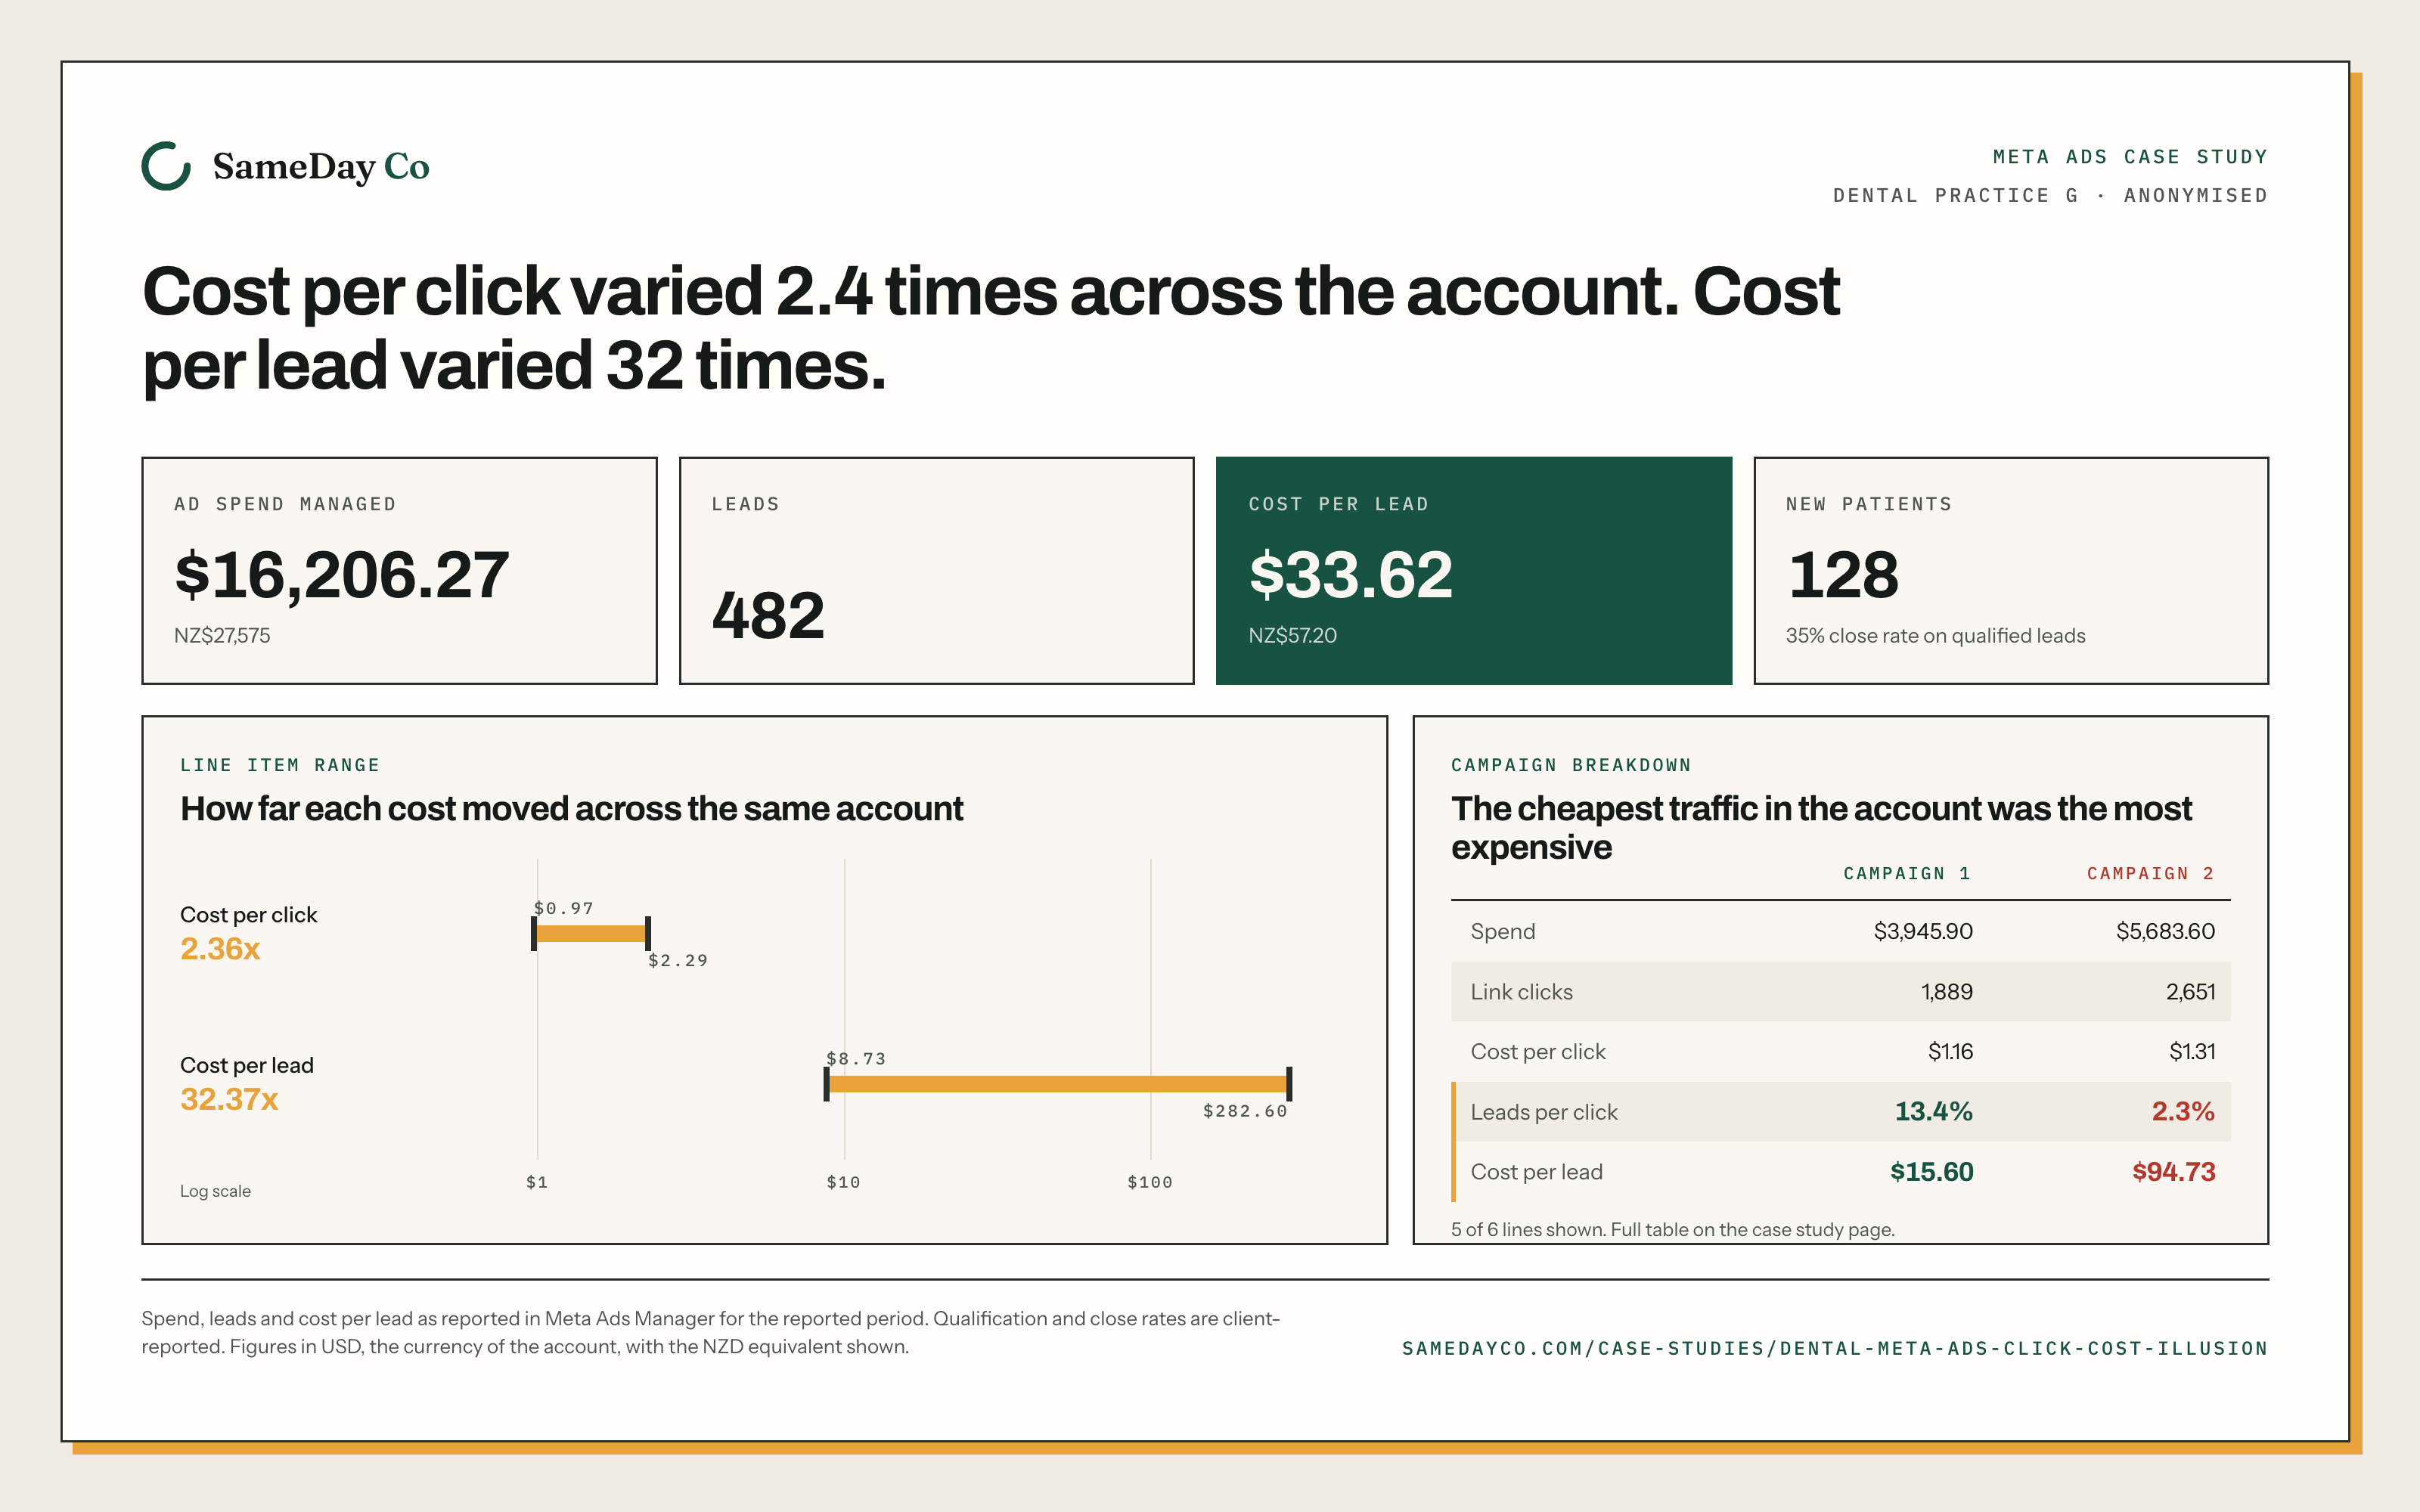
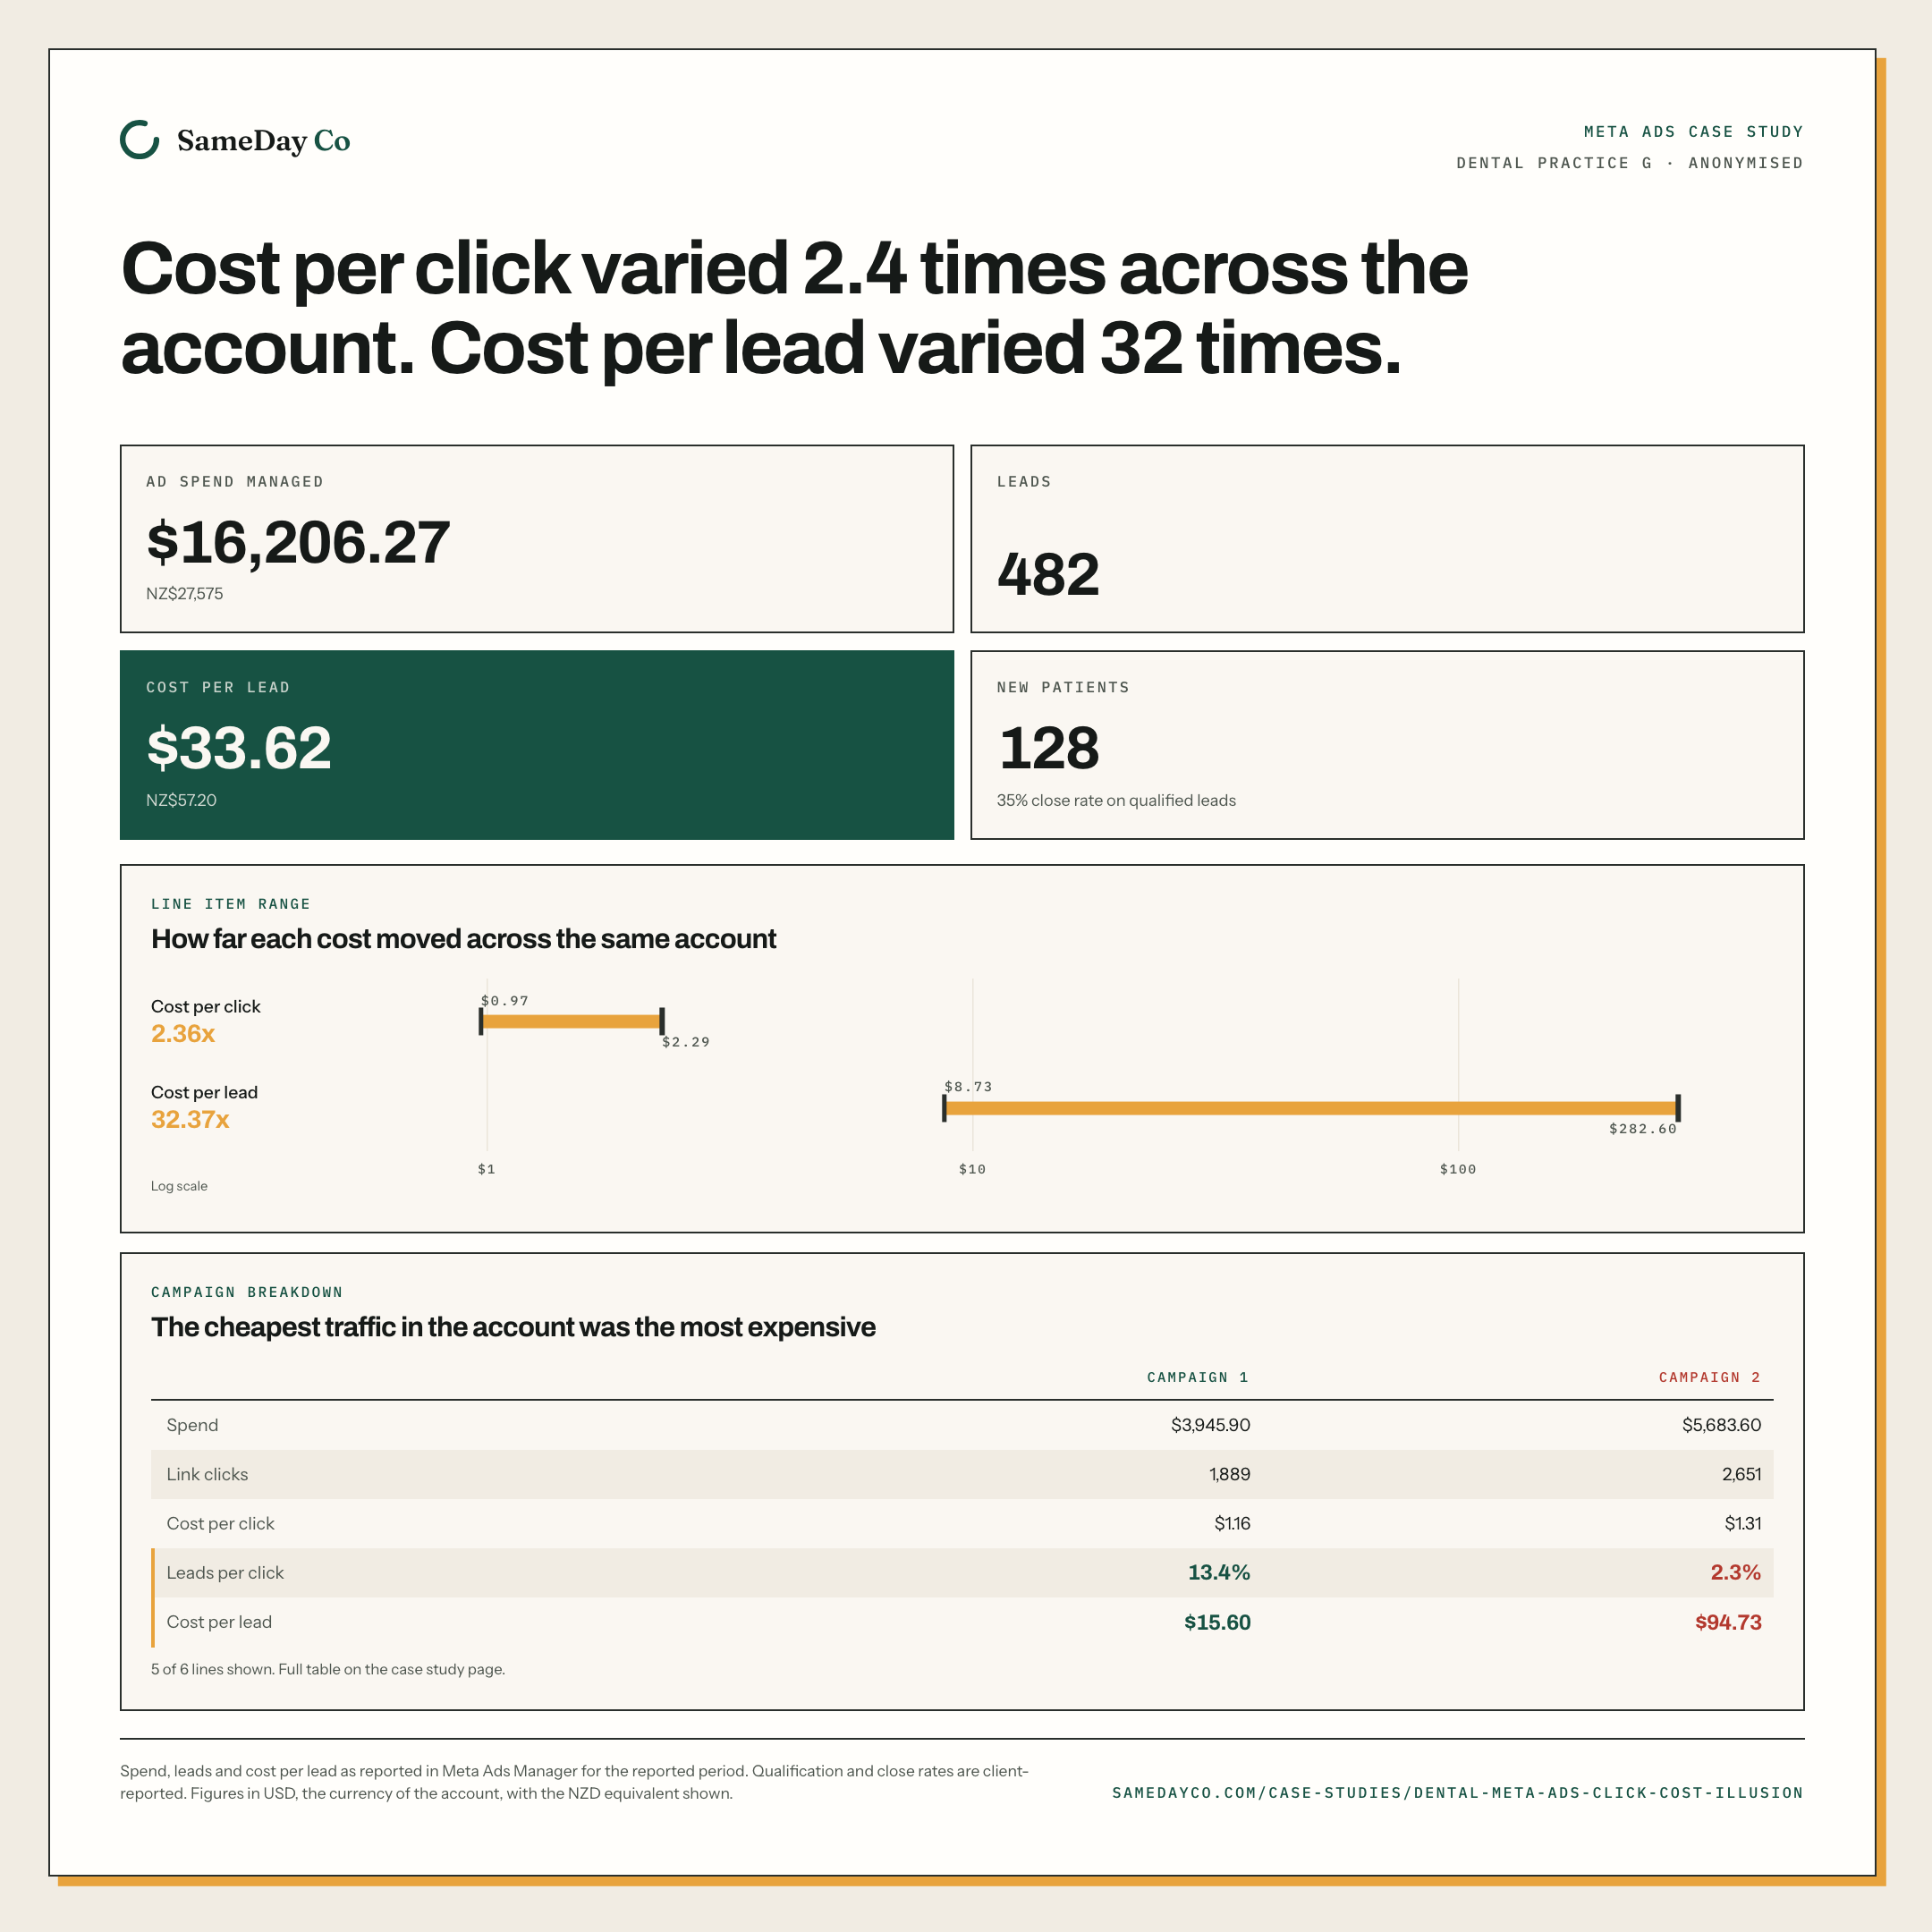
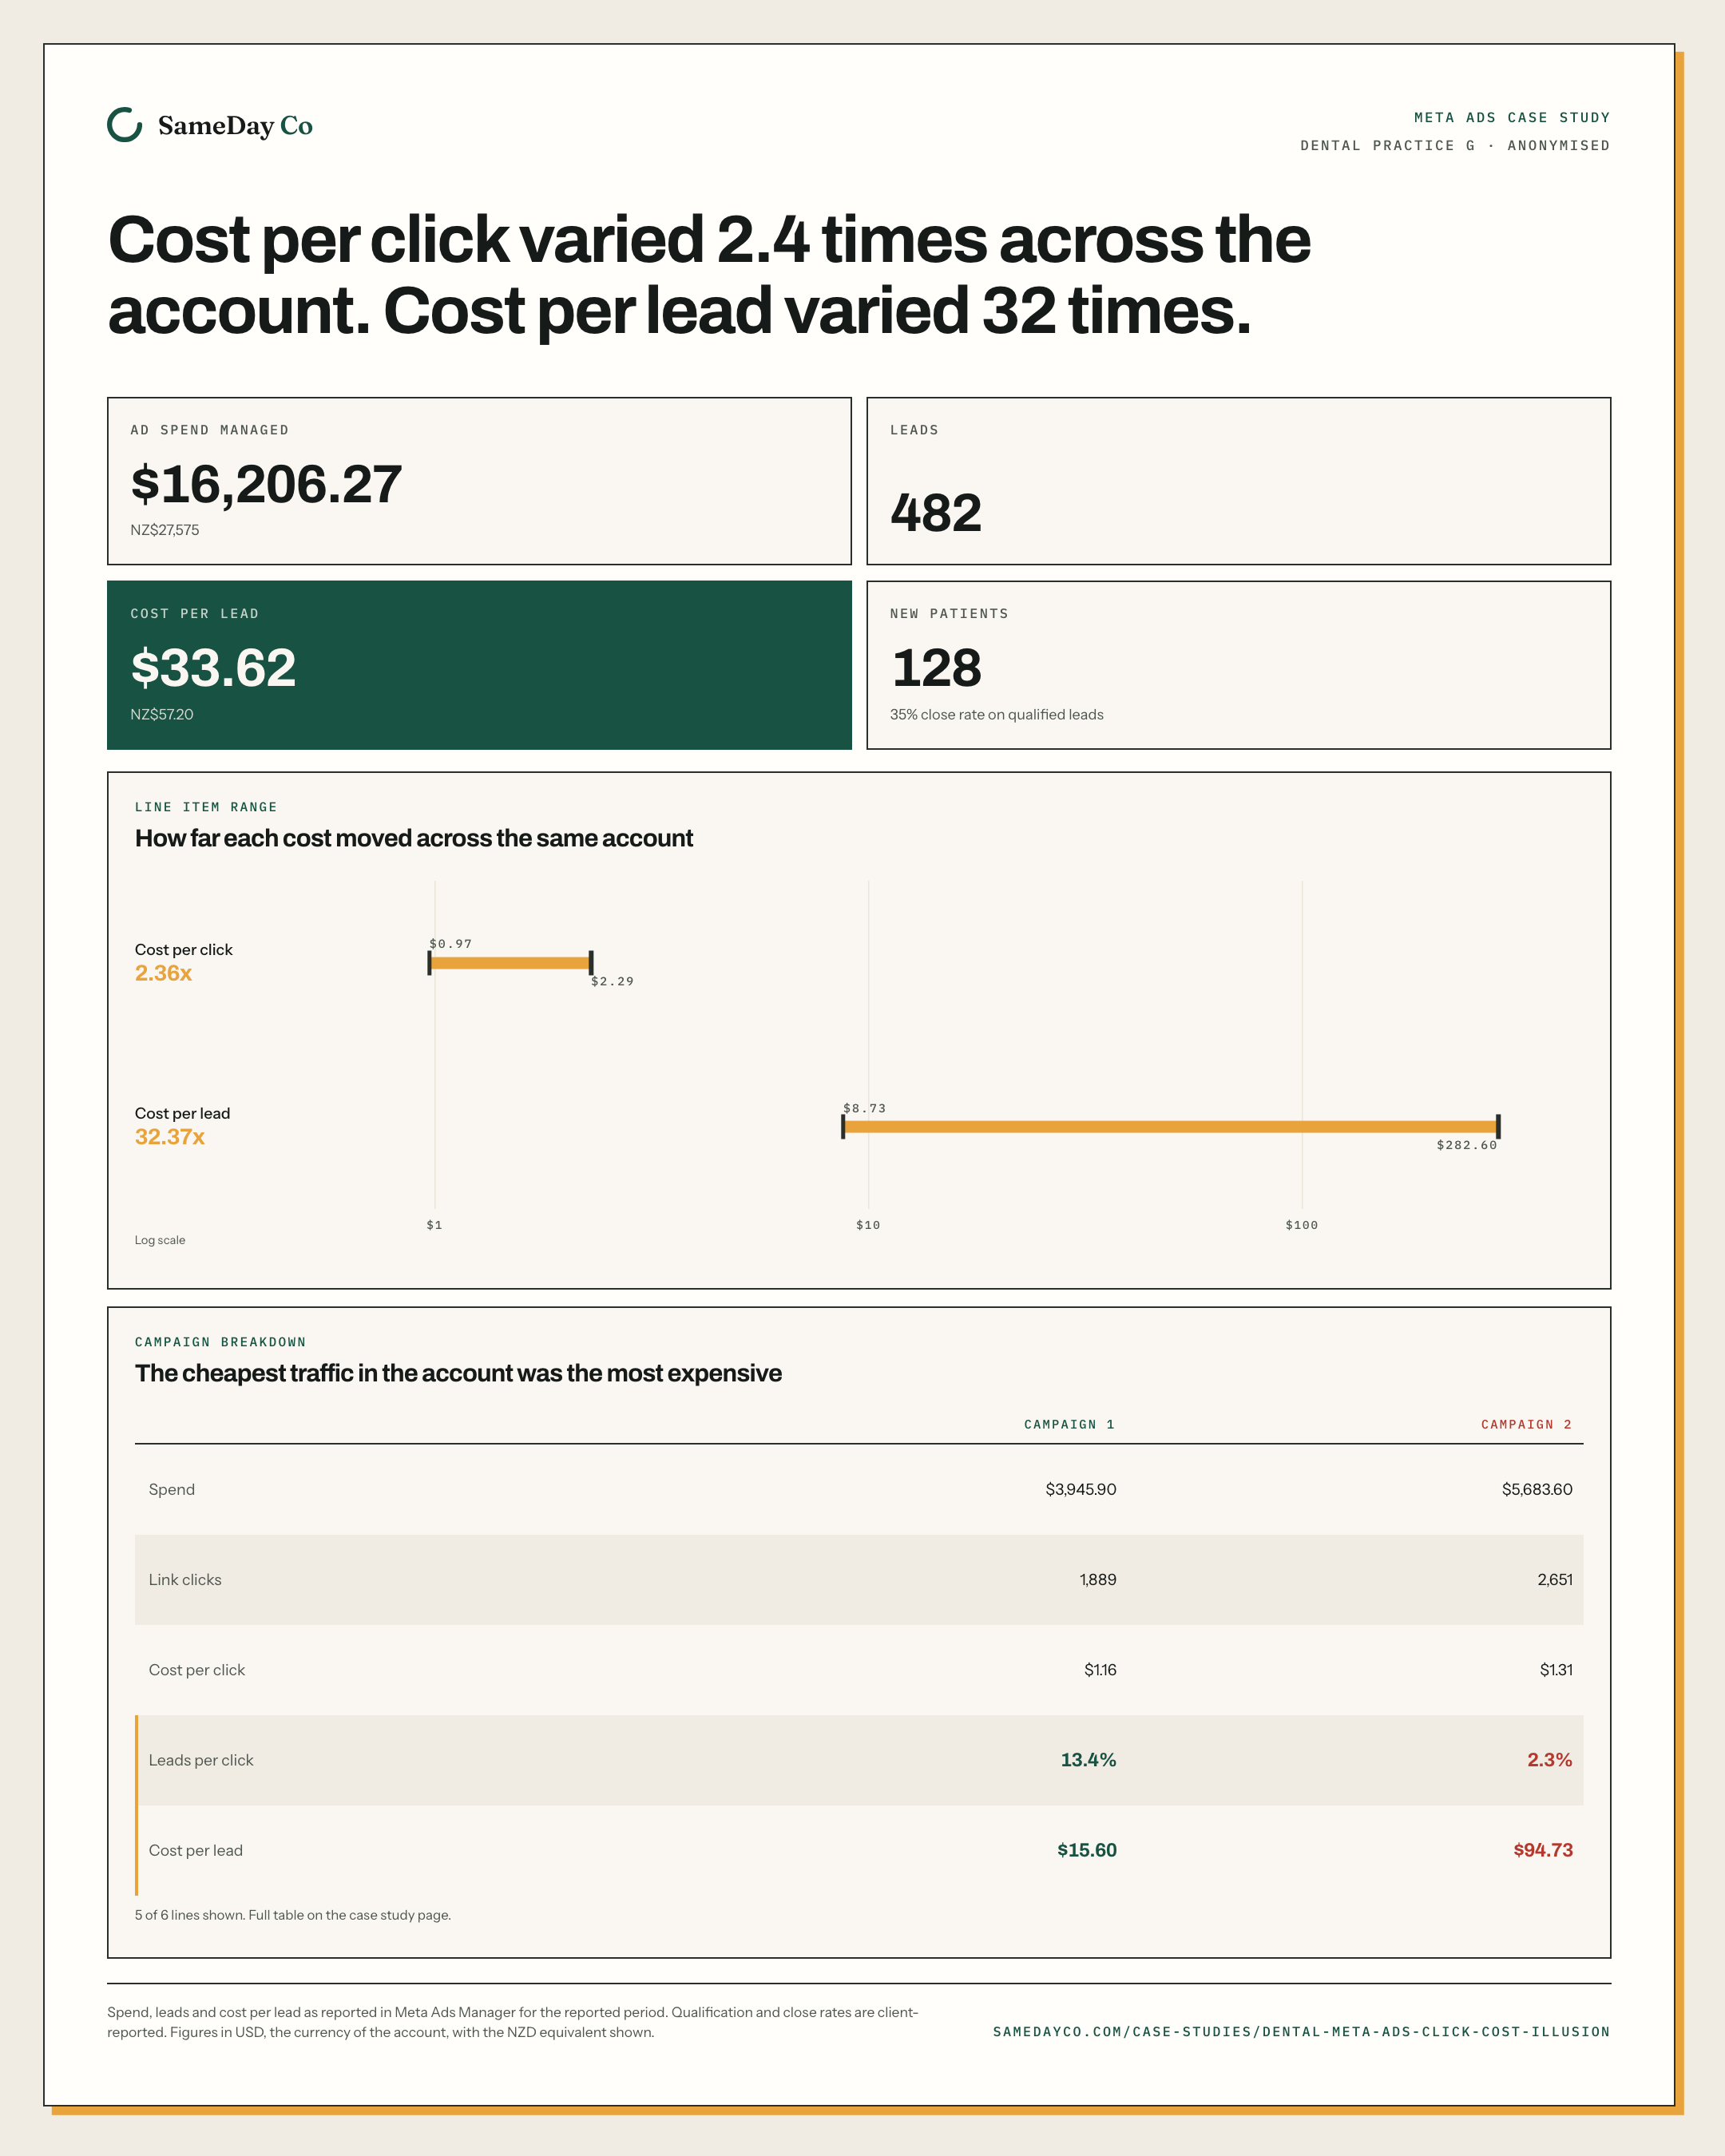
Cheap clicks are easy to buy and close to useless to report. Across this US$16,206.27 account, cost per click varied by a factor of 2.4 while cost per lead varied by a factor of 32. The line items that got expensive were not the ones paying more for a click: they were the ones losing people inside the form.
Dental · US$16,206.27 · Published 2026-08-05
The numbers
What the account actually did.
Figures are as recorded in the platform export for this account. United States dollars as spent, New Zealand dollars underneath at the rate on the methodology page.
- Ad spend managed
- $16,206.27NZ$27,575
- Leads
- 482
- Cost per lead
- $33.62NZ$57.20
- Qualified leads
- 36676% of leads
- New patients
- 12835% close rate on qualified leads
- Cost per new patient
- $126.40NZ$215.07
The line item rows visible in the export cover $14,807.53 of the $16,206.27 total, 475 of the 482 leads and 6,388 of the 6,899 clicks. That is 91% of spend. Charts below are drawn from the visible rows; the headline figures are account totals. Separately, hold rate falls as video length rises: a short clip reports a far higher hold rate than a long one with no difference in quality. The runtimes behind the creatives in this account have not been pulled or normalised, so every hold rate below should be read with that in mind. That caveat is scoped to hold rate. It does not extend to hook rate or to the lead counts elsewhere on this page.
Download this account as an image
The contradiction
Hold rate correlated with cost per lead at -0.517. Hook rate correlated at -0.063, which is nothing.
01
What the account was
Dental practice G ran $16,206.27 of Meta Ads spend generating 482 leads over the reported period, with video as the primary creative format and a lead-generation form as the offer. The exact campaign window is still being confirmed against the platform export.
The rows visible in the export cover 91% of that spend, 475 of the 482 leads and 6,388 of the 6,899 clicks. The charts on this page are drawn from those visible rows; the headline figures above are the account totals reported by the platform.
02
The cheap click illusion
Across the account, cost per click moved by a factor of 2.36, from $0.97 to $2.29. Cost per lead moved by a factor of 32.37, from $8.73 to $282.60. The traffic was bought at a consistently reasonable price for the entire period. What varied enormously was what happened to that traffic after it arrived.
Cost per click is the number an agency reports because it is stable and easy to defend. Cost per lead is the number that pays wages, and on this account the two told almost opposite stories.
Dental practice G, line item range
How far each cost moved across the same account
- Cost per click2.36x$0.97$2.29
- Cost per lead32.37x$8.73$282.60
Plotted on a logarithmic scale, so equal distances are equal multiples rather than equal dollars.
Log scale, because a linear axis would flatten the click band to a dot. The click price barely moved. The lead price moved by a factor of 32.
03
Where it shows up
Campaign 1 converted 13.4% of its clicks into leads, at $15.60 per lead. Campaign 2 converted 2.3%, at $94.73 per lead, more than six times the price.
The cost per click was $1.16 for Campaign 1 and $1.31 for Campaign 2, which is to say indistinguishable. A reviewer working from cost per click alone would have rated the two campaigns as roughly the same buy.
Dental practice G, campaign breakdown
The cheapest traffic in the account was the most expensive
The cheapest traffic in the account was the most expensive. Comparing Campaign 1 against Campaign 2. Spend: $3,945.90 against $5,683.60. Link clicks: 1,889 against 2,651. Cost per click: $1.16 against $1.31. Leads: 253 against 60. Leads per click: 13.4% against 2.3%. Cost per lead: $15.60 against $94.73.
| Measure | Campaign 1 | Campaign 2 |
|---|---|---|
| Spend | $3,945.90 | $5,683.60 |
| Link clicks | 1,889 | 2,651 |
| Cost per click | $1.16 | $1.31 |
| Leads | 253 | 60 |
| Leads per click | 13.4% | 2.3% |
| Cost per lead | $15.60 | $94.73 |
Campaign 2 bought clicks at a 13% premium and leads at six times the price. The difference is entirely what happened after the click.
04
Split the account at 8%
Splitting the account's line items at an 8% leads-per-click threshold produced a $16.66 cost per lead on the stronger side and a $90.49 cost per lead on the weaker side, a 5.4 times gap.
The uncomfortable part is what engagement showed. The weaker half held attention almost as well, a 34.5% hold rate against 38.6%, and hooked viewers slightly better, a 27.2% hook rate against 24.6%. Engagement did not separate the two segments. The weaker half still took 58% of the measured budget.
Dental practice G, segment analysis
Split the account at 8% leads per click
Split the account at 8% leads per click. Bars are United States dollars. 8% leads per click or better, $16.66. Under 8% leads per click, $90.49.
- 8% leads per click or better$16.66
5 line items, $6,081.85 spent, 365 leads, 38.6% hold rate, 24.6% hook rate
- Under 8% leads per click$90.49
5 line items, $8,325.10 spent, 92 leads, 34.5% hold rate, 27.2% hook rate
Five line items on each side. The weaker half held attention just as well and hooked it slightly better, and still cost 5.4 times more per lead. It also took 58% of the measured budget.
05
Hold rate, hook rate, and one useful conclusion
Hold rate correlated with cost per lead at -0.517, a moderate relationship. Hook rate correlated at -0.063, which carried effectively no information.
The practical conclusion is to judge a video by its edit rather than by its opening seconds. Correlation is not cause: this is one account over one date range, and the same relationship should be tested fresh on the next account rather than assumed to hold.
Dental practice G, correlation table
Hold rate carried a signal. Hook rate carried none.
Hold rate carried a signal. Hook rate carried none.. Hold rate: correlation -0.517. Hook rate: correlation -0.063. n = 10 line items. Correlation is not cause.
- Hold rate-0.517-10+1
Moderate: higher hold rate, lower cost per lead
- Hook rate-0.063-10+1
The first three seconds predicted nothing
n = 10 line items. Correlation is not cause: these are relationships inside one account, not laws.
Negative means the two moved in opposite directions. Correlation is not cause: one account, one date range.
06
What transfers to a New Zealand clinic
What transfers from this account is method, not price. Report cost per lead rather than cost per click: on this account the two moved in opposite directions, and a report built around clicks would have missed the entire story.
Set a leads-per-click threshold before launch, and expect the spread between the best and worst line items to be wide rather than narrow, as it was here on both cost per click and cost per lead.
Case studies reflect specific clinics and circumstances. Outcomes depend on market, budget, competition, clinic capacity, reception follow-up, timing and account history. Figures are historical examples, not typical-results claims, forecasts or guarantees.

The free Ad Check
Two written pages on your clinic's advertising. Free.
Your ads, site and Google profile wording, reviewed against your profession's advertising rules, the ASA Therapeutic and Health Advertising Code and the Fair Trading Act. In your inbox within two NZ business days. No call, no follow-up sequence, no obligation.
Free · Async · Two NZ business days