Dental practice H
US$54,718 of dental Meta spend, and the metric that actually predicted cost
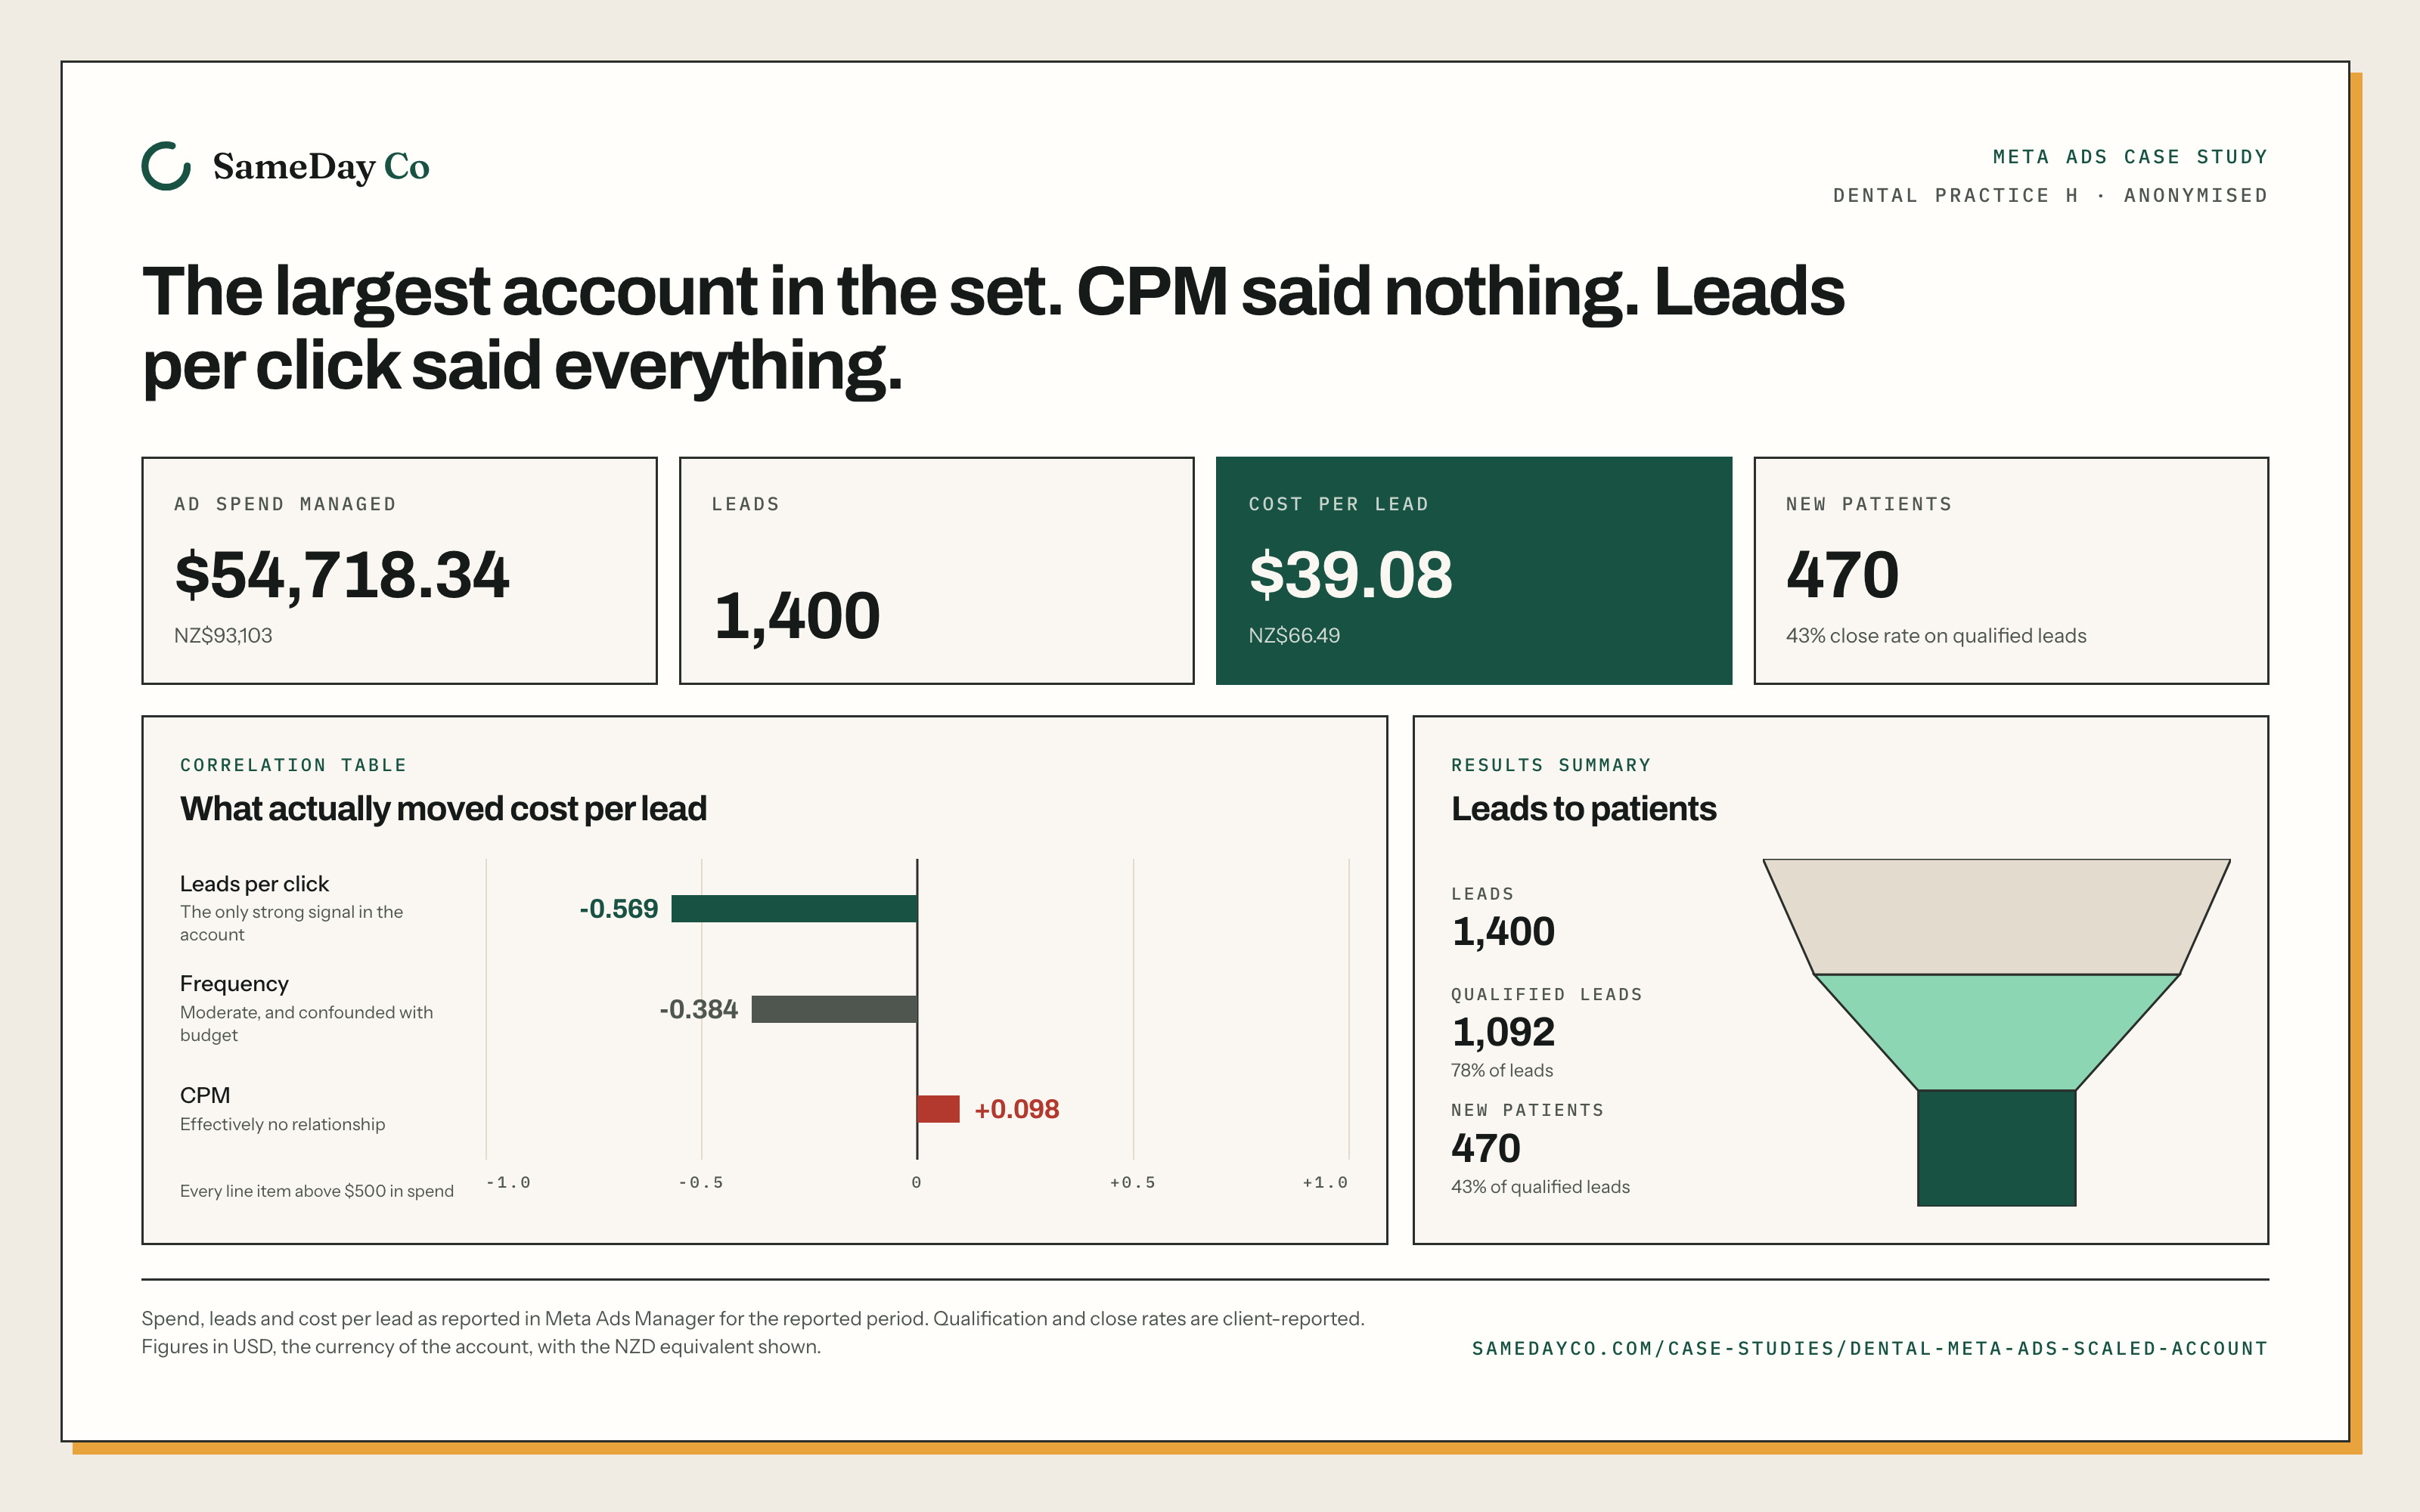
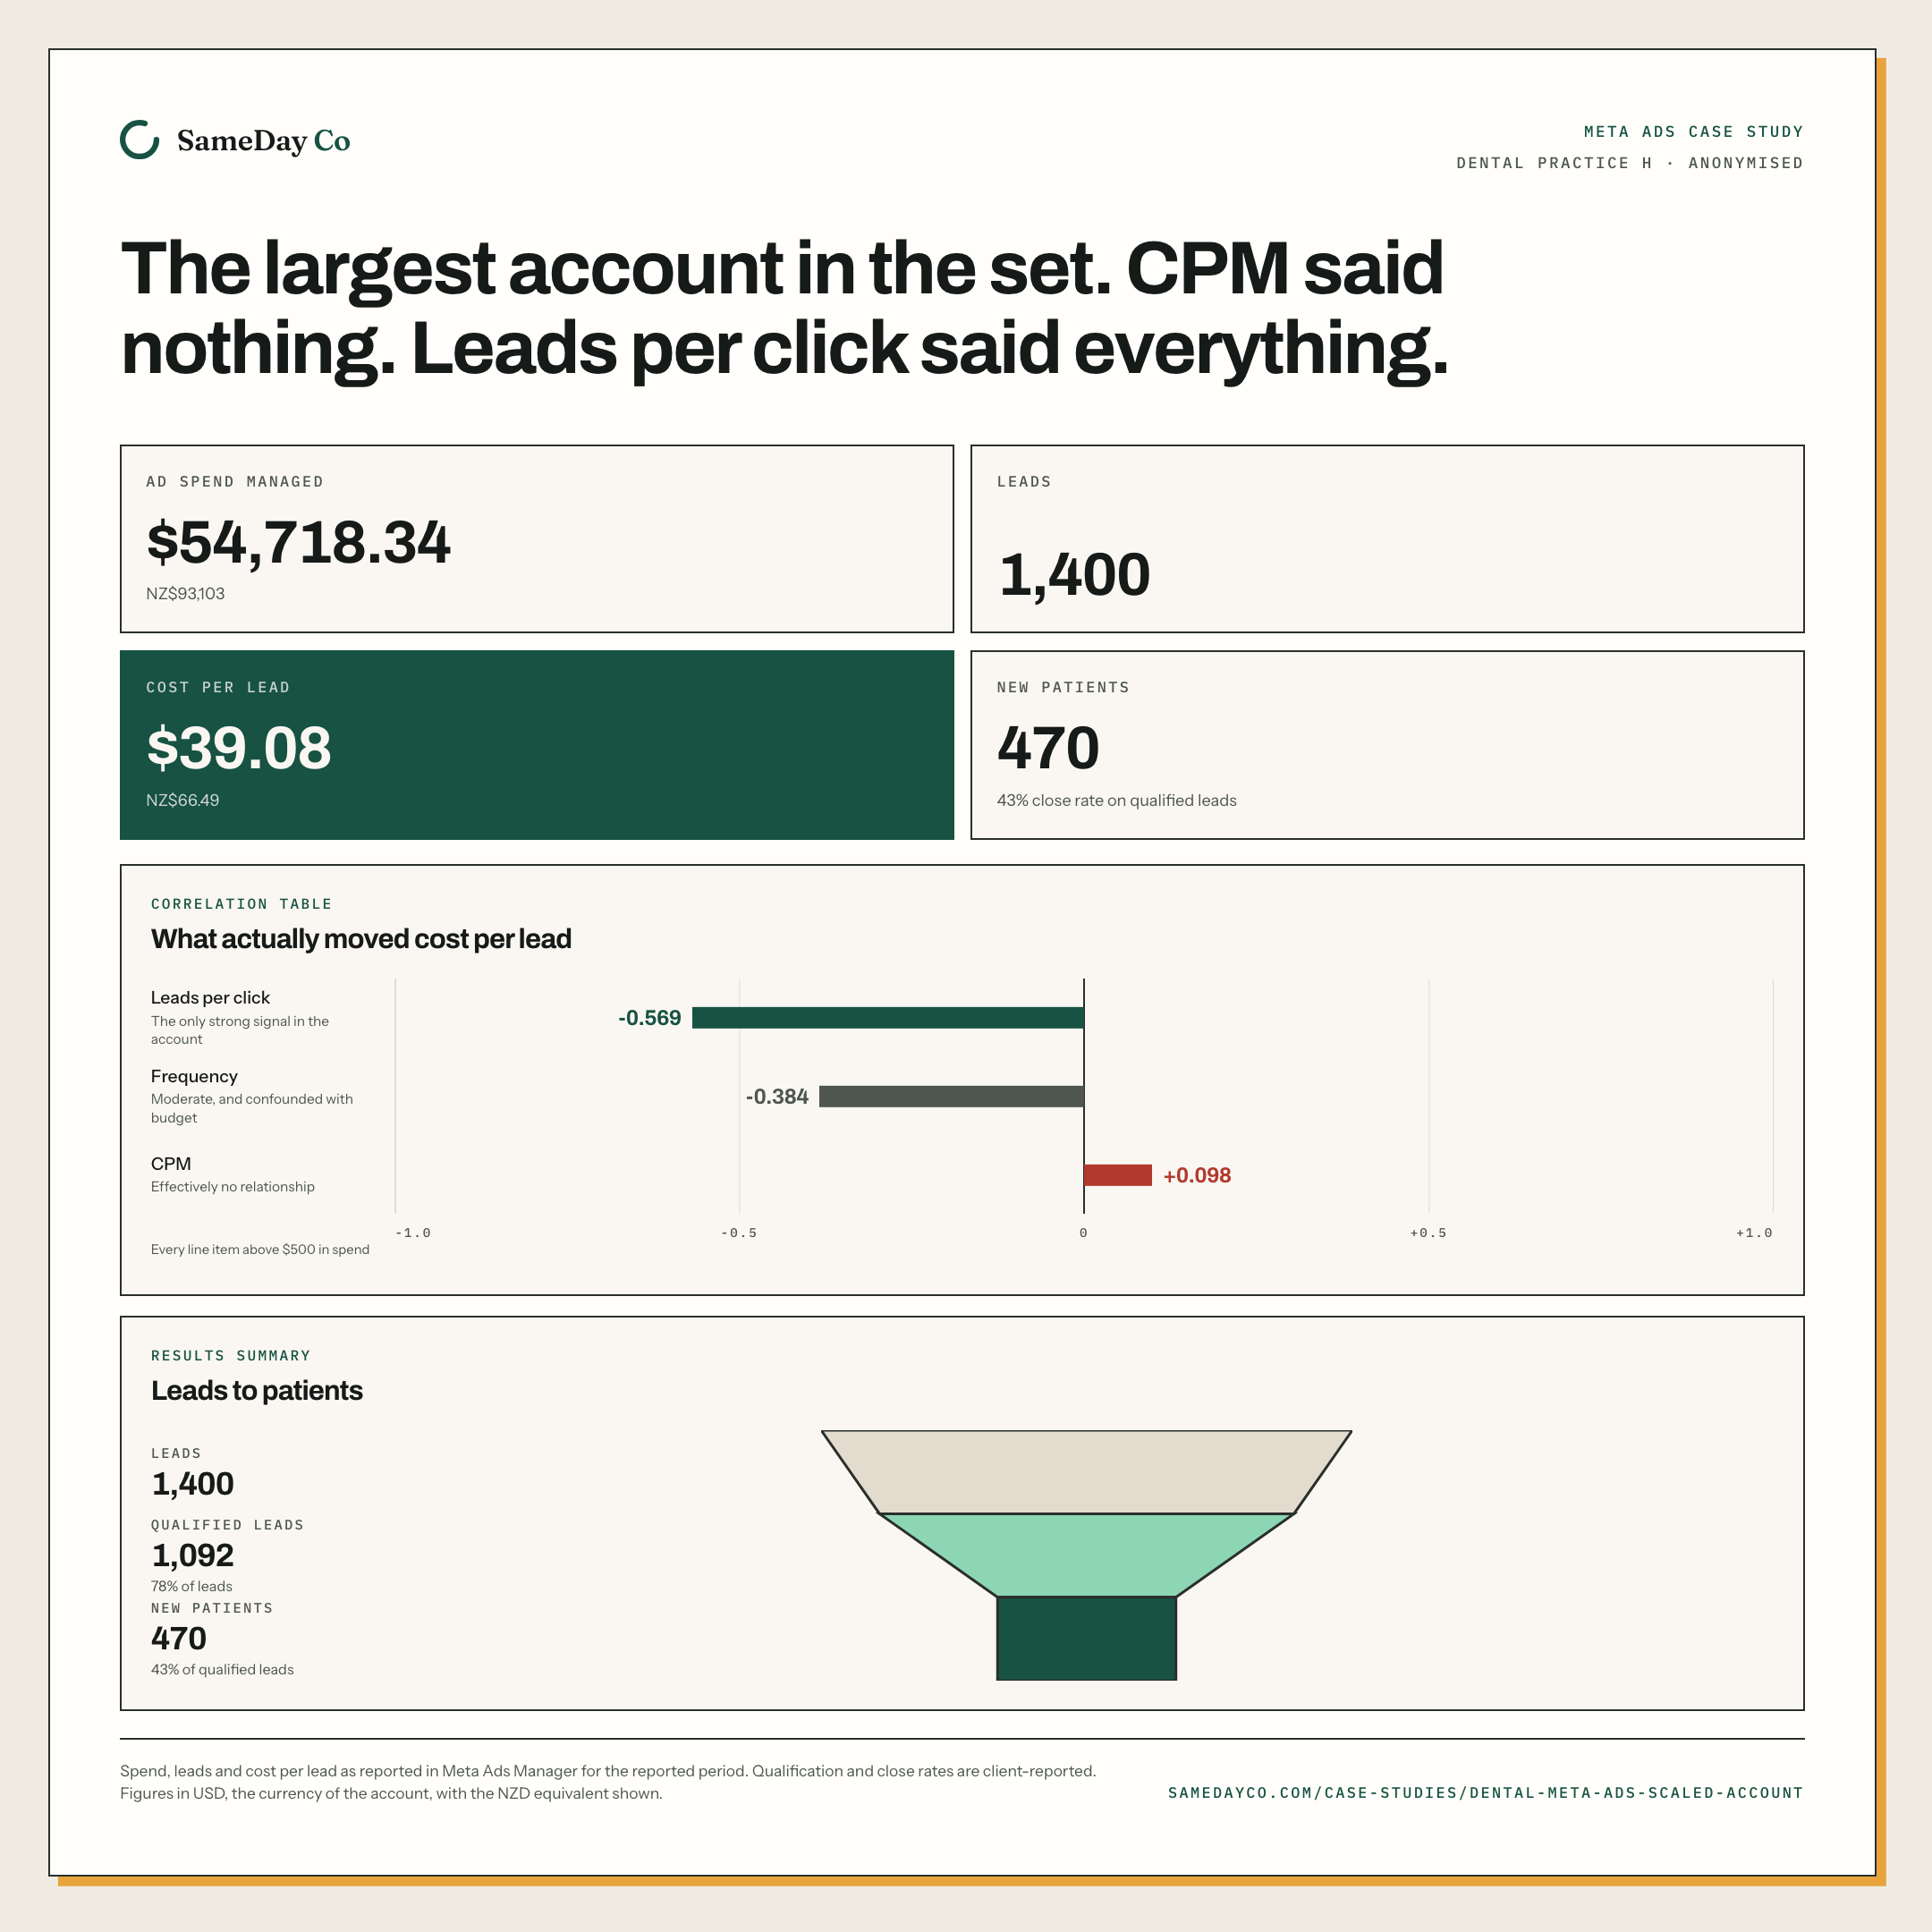
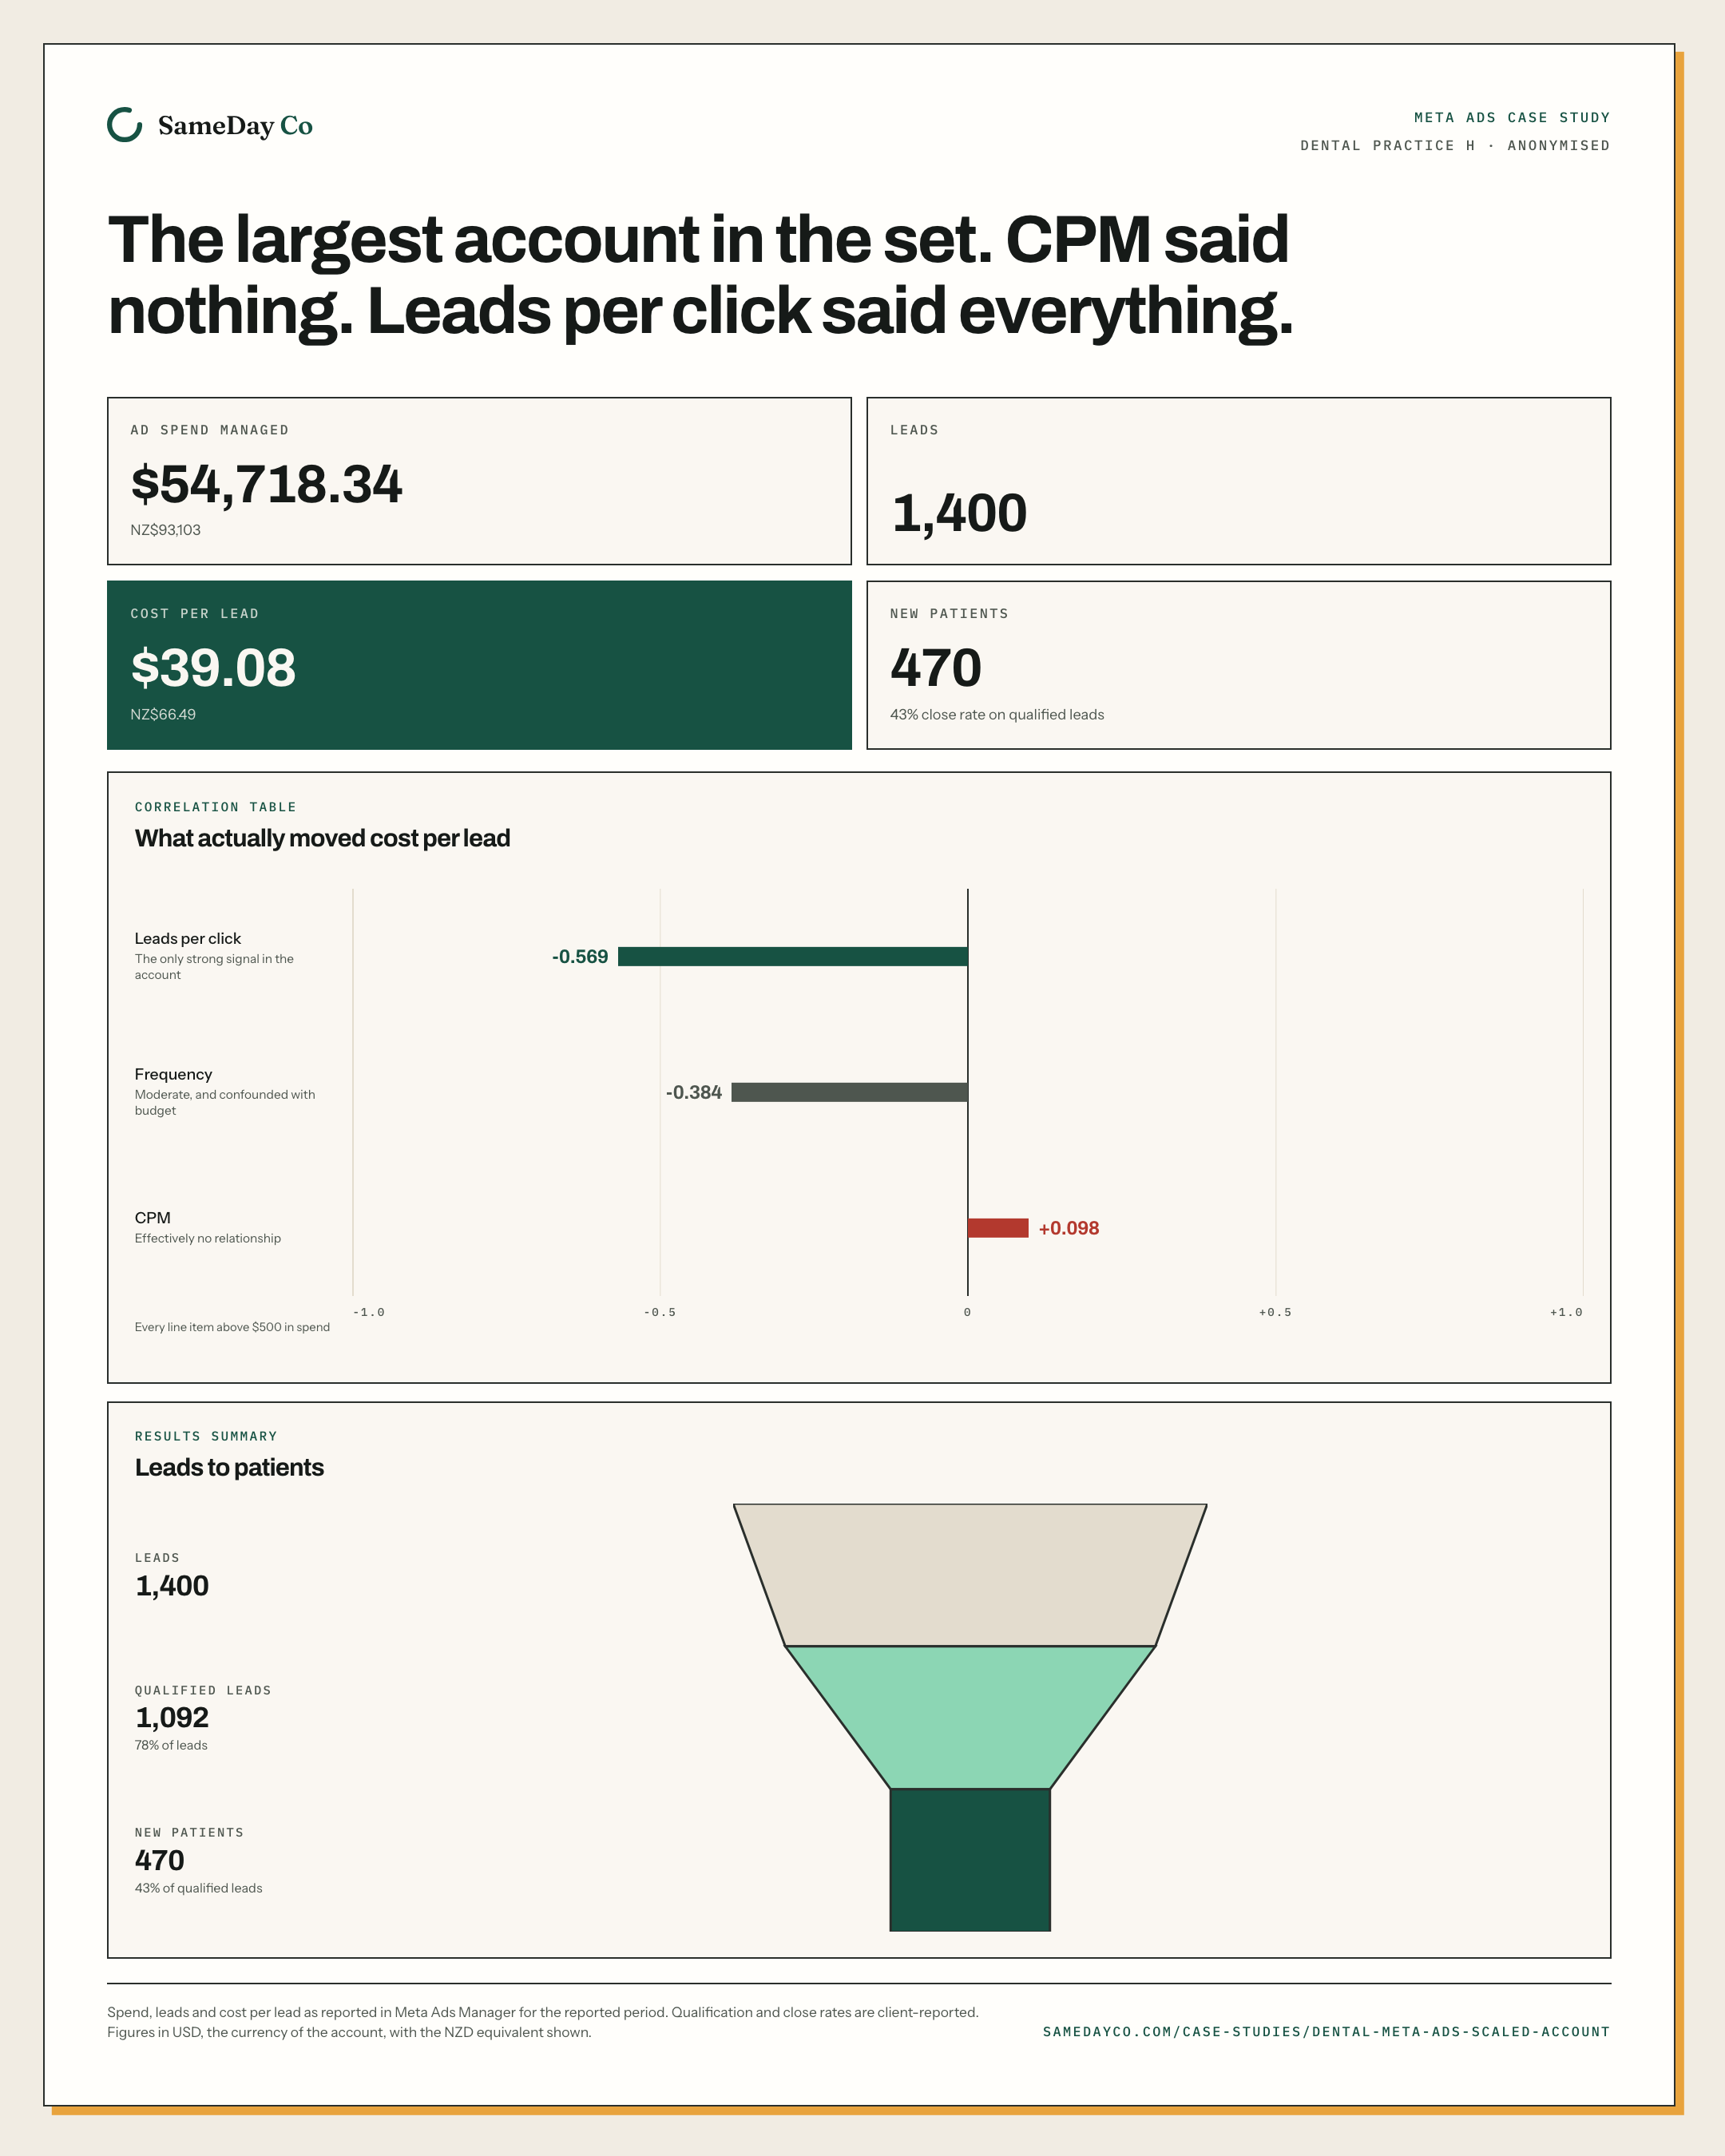
This is the largest account in the set: US$54,718.34 of Meta spend and 1,400 leads at US$39.08 each. The metric most often quoted back in a monthly report, CPM, had effectively no relationship with what a lead actually cost. What did track it was leads per click, which measures what happened after the click rather than what it took to buy one.
Dental · US$54,718.34 · Published 2026-08-05
The numbers
What the account actually did.
Figures are as recorded in the platform export for this account. United States dollars as spent, New Zealand dollars underneath at the rate on the methodology page.
- Ad spend managed
- $54,718.34NZ$93,103
- Leads
- 1,400
- Cost per lead
- $39.08NZ$66.49
- Qualified leads
- 1,09278% of leads
- New patients
- 47043% close rate on qualified leads
- Cost per new patient
- $116.53NZ$198.28
Download this account as an image
The contradiction
CPM correlated with cost per lead at +0.098, which is to say not at all. Leads per click correlated at -0.569.
01
What the account was
Dental practice H is the largest account in this set: $54,718.34 in Meta Ads spend across 1,400 leads over the reported period. The channel was Meta, Facebook and Instagram, video was the primary creative format, and the offer ran to a lead-generation form. The exact campaign window is still being confirmed against the platform export.
The clinic is anonymised throughout, and the market it operated in is not stated. What can be read from the numbers below is the shape of the account, not a location or a price to expect elsewhere.
02
Two campaigns, one account, opposite prices
Campaign A bought clicks at $1.36 and leads at $41.63. Campaign B bought clicks at $2.18, 60% more per click, and leads at $33.59, 19% cheaper. Anyone optimising toward cost per click alone would have kept funding Campaign A and starved the campaign that was actually working.
Frequency sat at 3.75 for Campaign A against 2.54 for Campaign B. The gap is worth watching, not treated as the cause: these are two line items in one account over one period, and frequency moving alongside a cost difference is not the same as frequency producing it.
Dental practice H, campaign breakdown
Two campaigns, same account, same period
Two campaigns, same account, same period. Comparing Campaign A against Campaign B. Spend: $22,647.15 against $16,491.78. Leads: 544 against 491. Cost per lead: $41.63 against $33.59. Cost per click: $1.36 against $2.18. Link clicks: 9,917 against 4,489. Leads per click: 5.5% against 10.9%. Frequency: 3.75 against 2.54. CPM: $47.74 against $47.34.
| Measure | Campaign A | Campaign B |
|---|---|---|
| Spend | $22,647.15 | $16,491.78 |
| Leads | 544 | 491 |
| Cost per lead | $41.63 | $33.59 |
| Cost per click | $1.36 | $2.18 |
| Link clicks | 9,917 | 4,489 |
| Leads per click | 5.5% | 10.9% |
| Frequency | 3.75 | 2.54 |
| CPM | $47.74 | $47.34 |
Campaign B cost 60% more per click and delivered leads 19% cheaper. Cost per click is a price, not a result. Every row here is as reported in the export, and the cost per click shown does not equal this spend divided by these link clicks. The export does not record why, so no reason is offered for it here.
03
What actually predicted cost per lead
Three signals were tested against cost per lead across every line item above $500 in spend. Leads per click correlated at -0.569, by far the strongest relationship in the account. Frequency correlated at -0.384. CPM, the number most often quoted back in a monthly report as if it stood for performance, correlated at +0.098: effectively no relationship at all.
That is the one worth sitting with. An account can be reported entirely in CPM and still tell you almost nothing about what a lead is going to cost. This is one account over one date range, and only the line items above $500 in spend within it: a signal worth acting on, not a law. It describes what happened here, not what will happen everywhere.
Dental practice H, correlation table
What actually moved cost per lead
What actually moved cost per lead. Leads per click: correlation -0.569. Frequency: correlation -0.384. CPM: correlation +0.098. Every line item above $500 in spend. Correlation is not cause.
- Leads per click-0.569-10+1
The only strong signal in the account
- Frequency-0.384-10+1
Moderate, and confounded with budget
- CPM+0.098-10+1
Effectively no relationship
Every line item above $500 in spend. Correlation is not cause: these are relationships inside one account, not laws.
Negative means the two moved in opposite directions. Correlation is not cause: this is every line item above $500 in spend in one account over one date range, not an experiment.
04
The 28-fold spread inside one account
The best line item in the account bought leads at $9.81. The worst bought them at $278.79, on almost the same spend, a 28-fold spread inside a single account. The best line item ran a leads-per-click rate of 23.3% and a frequency of 1.40.
The account-wide average of $39.08 describes neither end of that range. It is an average of a $9.81 line item and a $278.79 line item sitting side by side, and reporting only the average hides the decision that actually mattered: which line items to keep funding and which to cut.
Dental practice H, line item breakdown
The spread inside one account
The spread inside one account. Bars are United States dollars. Best line item, $9.81. Second, $56.77. Third, $82.76. Worst line item, $278.79.
- Best line item$9.81
$539.55 spent, 55 leads, 23.3% leads per click, frequency 1.40
- Second$56.77
$3,917.16 spent, 69 leads
- Third$82.76
$2,565.46 spent, 31 leads
- Worst line item$278.79
$557.57 spent, 2 leads
Four line items from the same account over the same reported period, ordered by cost per lead. Best to worst is a 28-fold gap. This is why an account-level average hides the decision.
05
Leads, then qualified leads, then patients
1,400 leads became 1,092 qualified leads, a 78% qualification rate, and 1,092 qualified leads became 470 new patients, a 43% close rate. Qualification is the clinic's judgement, not the platform's: it is the clinic deciding a lead is the right service, contactable, and not already a patient. The close rate that follows is the clinic's front desk, not the ad account.
Cost per new patient came out at $116.53. That figure is calculated on unrounded counts, so dividing the published spend of $54,718.34 by the published patient count of 470 lands a few cents away from it. Both are correct: they are two different divisions of the same underlying numbers.
Dental practice H, results summary
Leads to patients
Leads to patients. Leads: 1,400. Qualified leads: 1,092, 78% of leads. New patients: 470, 43% of qualified leads.
- 1,400Leads
- 1,092Qualified leads
78% of leads
- 470New patients
43% of qualified leads
Qualification is the clinic's judgement, not the platform's. The close rate is the clinic's front desk, not the ad.
06
What transfers to a New Zealand clinic
What transfers from this account is a method, not a price. Watch leads per click rather than CTR or CPM: it was the metric that predicted cost per lead here, and CPM did not. Split the account at whatever leads-per-click line separates the top half from the bottom half, and cut the tail rather than letting it coast on its historical spend.
Expect the spread inside an account to be wide, not narrow: this account's best and worst line items landed on very different prices on comparable budget. There is no promise or projected figure to draw from this page, and no New Zealand number either: auction costs move with the market, the season and the offer, and none of those transfer.
Case studies reflect specific clinics and circumstances. Outcomes depend on market, budget, competition, clinic capacity, reception follow-up, timing and account history. Figures are historical examples, not typical-results claims, forecasts or guarantees.

The free Ad Check
Two written pages on your clinic's advertising. Free.
Your ads, site and Google profile wording, reviewed against your profession's advertising rules, the ASA Therapeutic and Health Advertising Code and the Fair Trading Act. In your inbox within two NZ business days. No call, no follow-up sequence, no obligation.
Free · Async · Two NZ business days